MY RESPONSIBIITIES
Building Intoglo's 'All Shipments' and 'Shipment Details' Pages
Intoglo's rapid growth and increasing shipments per client made it challenging to manage and track the statuses of all the shipments and their details on the existing mobile interface.
As a sole UX Designer, I was tasked with creating the desktop experience from scratch, incorporating new features to improve visibility across the supply chain, from shipment creation to delivery, and delivering a design that achieved the following:
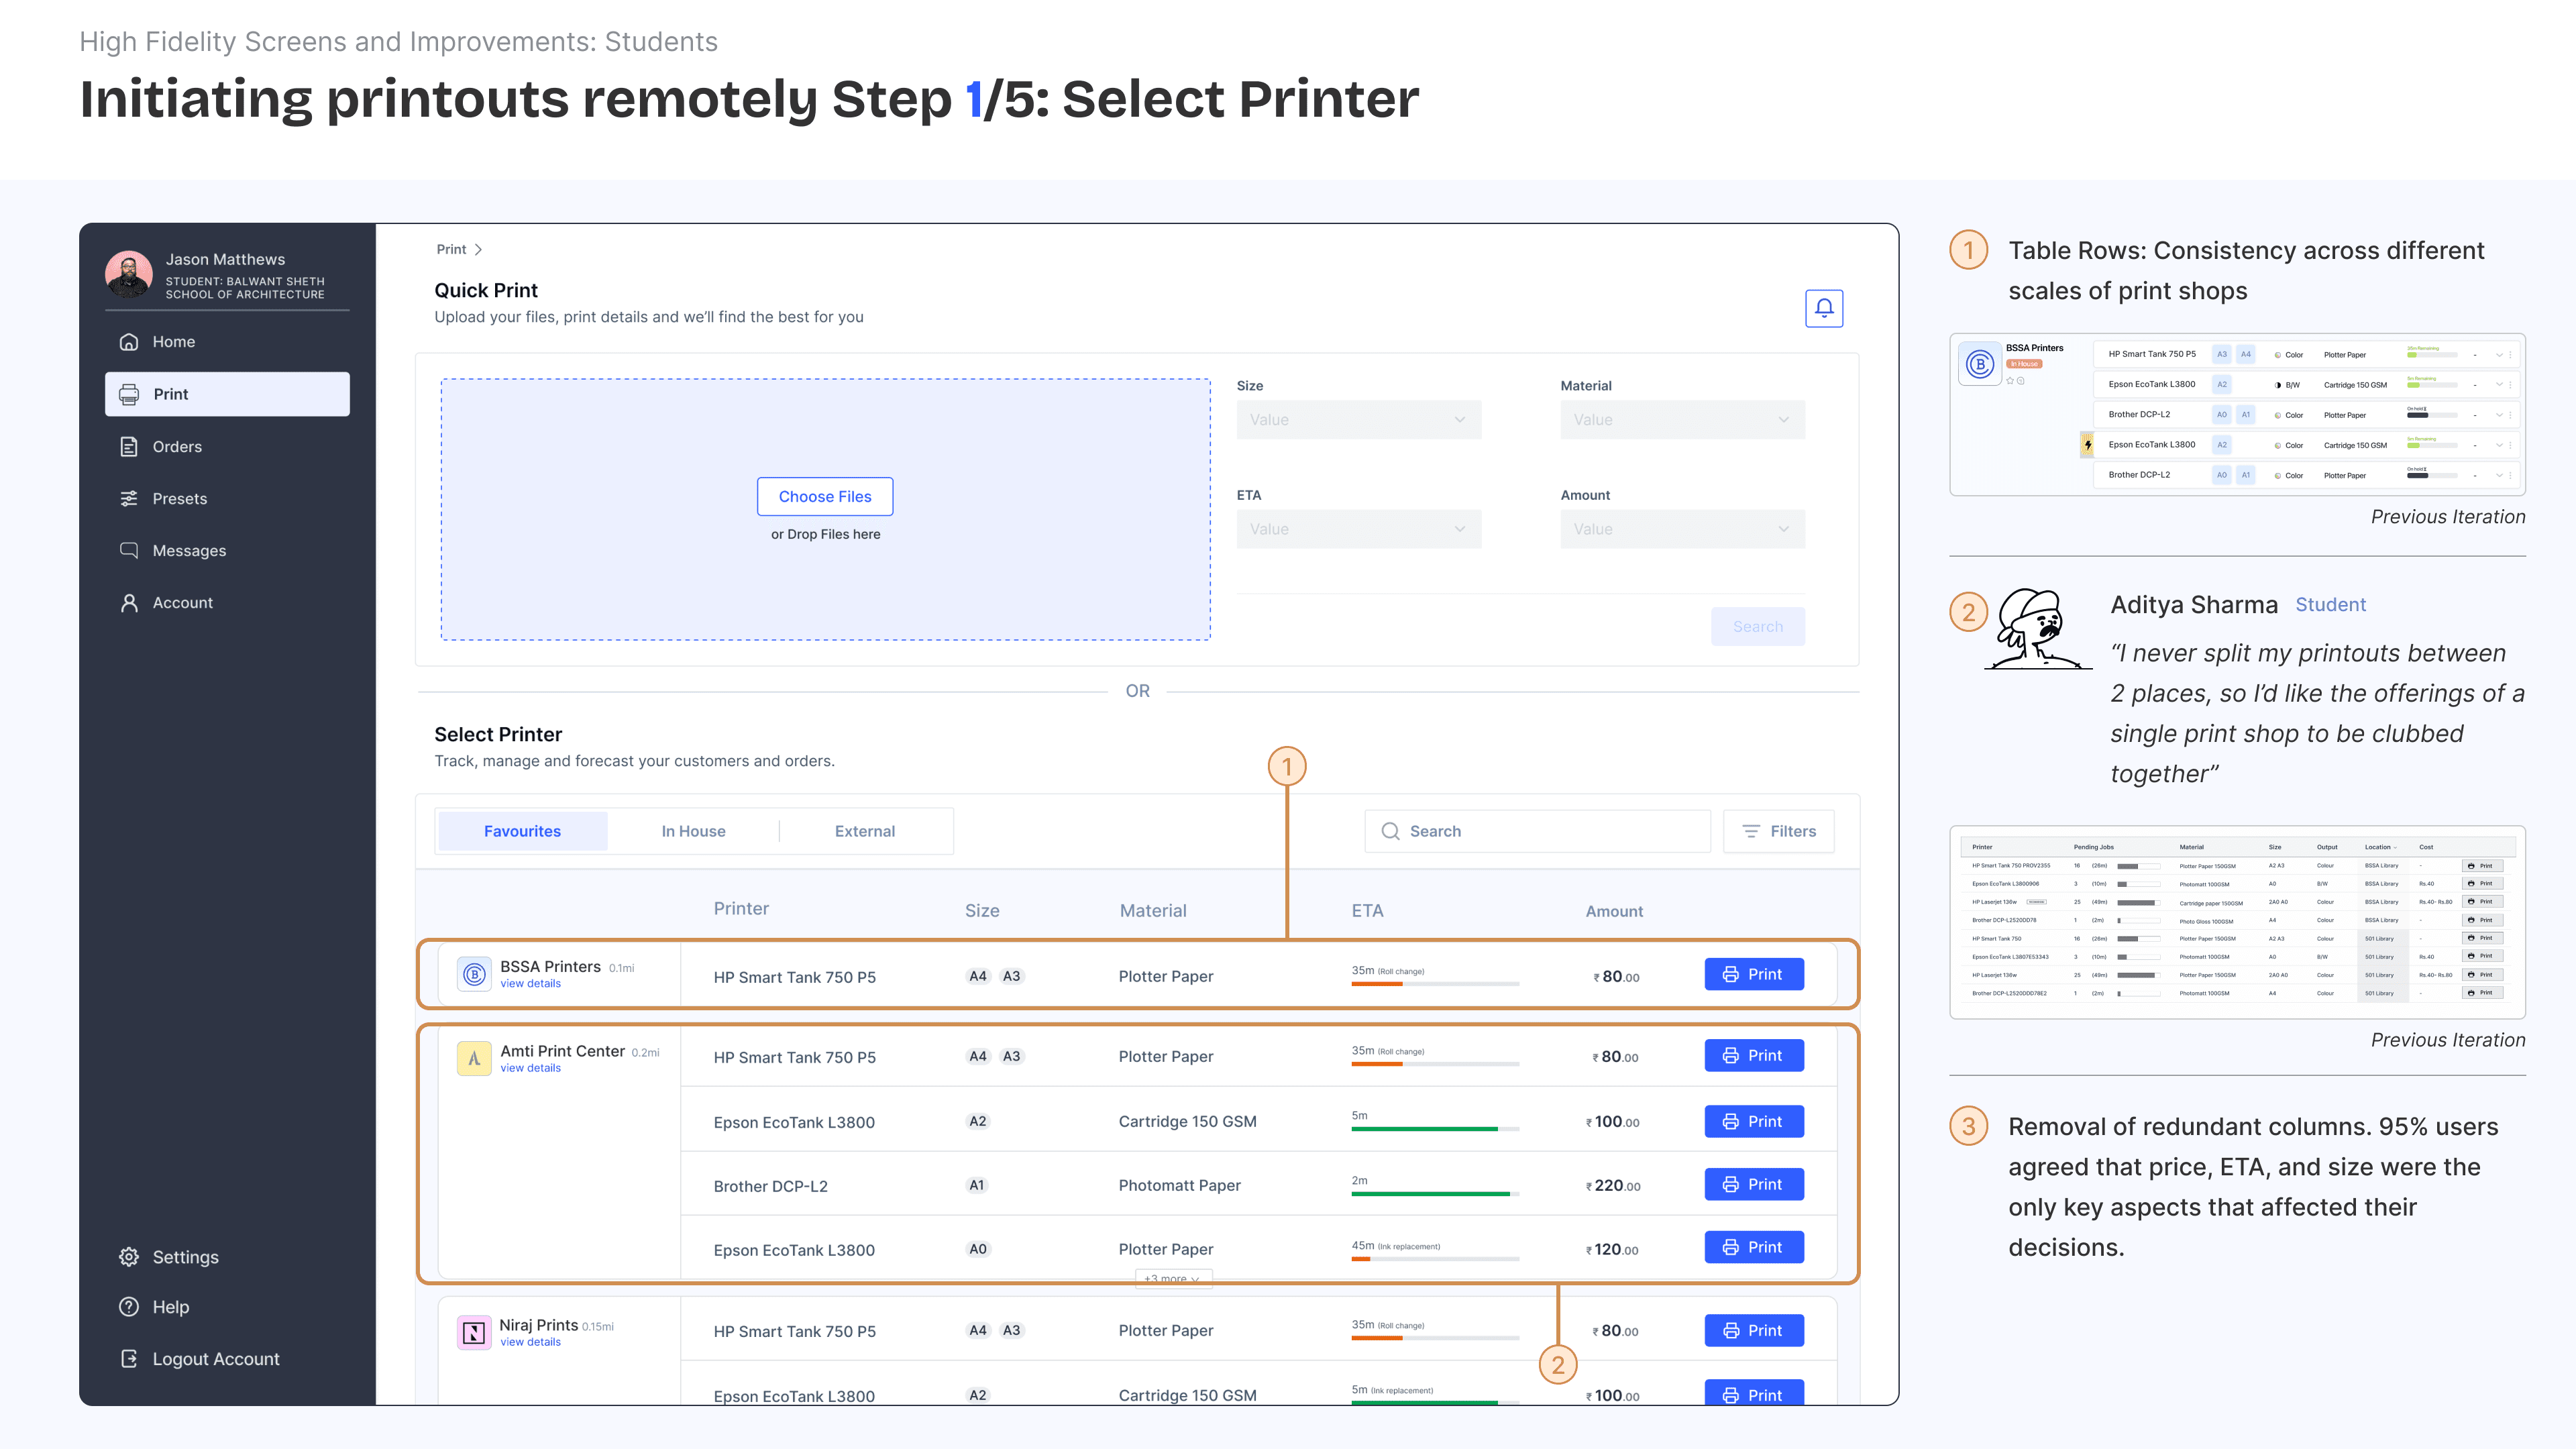
While the stepper effectively conveyed the entire shipment route and current status to users, we wondered if this design offered a substantial usability advantage over our competitors.
Through this design, we also realized we were putting too much focus on the shipment route, leaving all the other important information crammed to the side.
Given that this iteration could only display 3-4 shipments at a time, we had some reservations and decided to take a step back and consider alternative ideas that better aligned to our initially set design requirements.


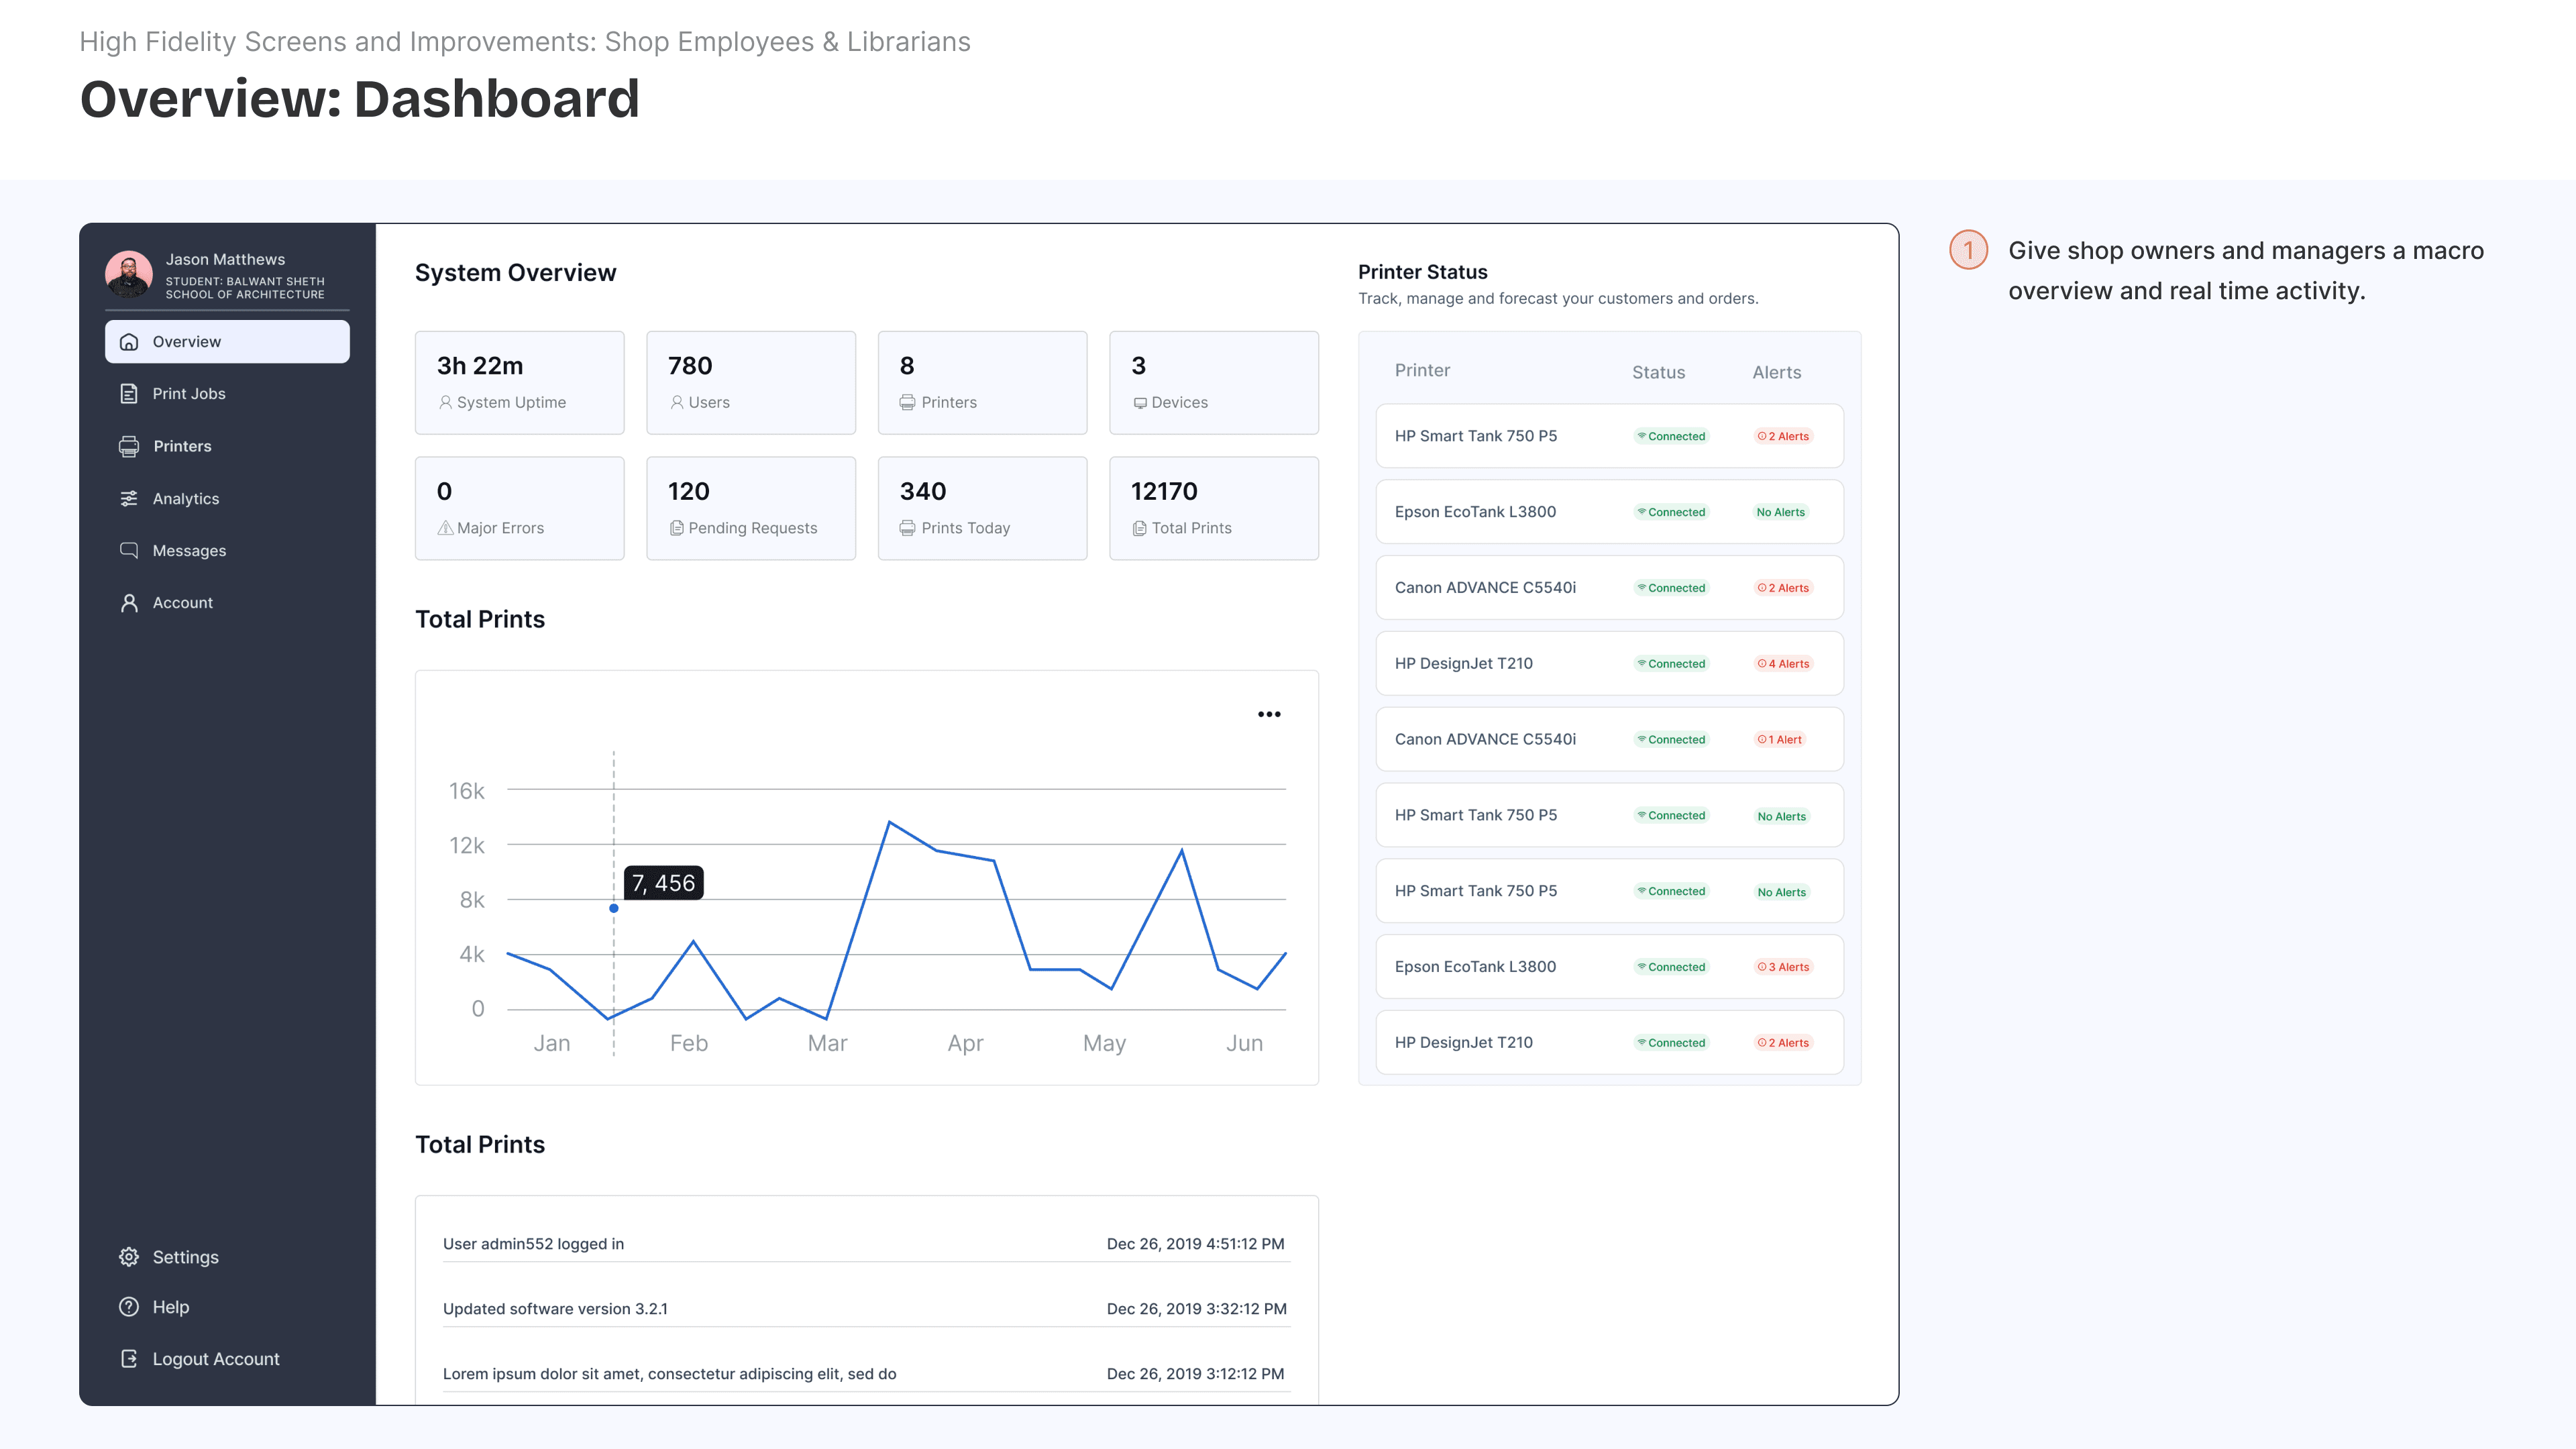
Improving visibility and control over the supply chain
Role
UX Designer
UX Designer
Project Type
Professional Work
Duration
3 Months
3 Months: Sep 24-Dec 24
Team
Sudharshan (PM), Bharani (CTO), Lugman (SWE)
MY RESPONSIBIITIES
Building Intoglo's 'All Shipments' and 'Shipment Details' Pages
Intoglo's rapid growth and increasing shipments per client made it challenging to manage and track the statuses of all the shipments and their details on the existing mobile interface.
As a sole UX Designer, I was tasked with creating the desktop experience from scratch, incorporating new features to improve visibility across the supply chain, from shipment creation to delivery, and delivering a design that achieved the following:

IDEATION: PT.1
The wide range of potential shipment routes made it challenging to generate a stepper specific to each one.
Preliminary concepts examined how various shipment routes influenced their respective visualizations.
While the stepper effectively conveyed the entire shipment route and current status to users, we wondered if this design offered a substantial usability advantage over our competitors.
Through this design, we also realized we were putting too much focus on the shipment route, leaving all the other important information crammed to the side.
Given that this iteration could only display 3-4 shipments at a time, we had some reservations and decided to take a step back and consider alternative ideas that better aligned to our initially set design requirements.

Preliminary concepts examined how various shipment routes influenced their respective visualizations.
We initially attempted to improve this by adding a calendar view to highlight completed and upcoming updates for specific dates, but the previous issues continued to persist.

Preliminary concepts examined how various shipment routes influenced their respective visualizations.
IDEATION: PT.1
Our attempts to standardize this by generating one specific stepper would lead to duplication of information depending on the type of shipment route (see example below)
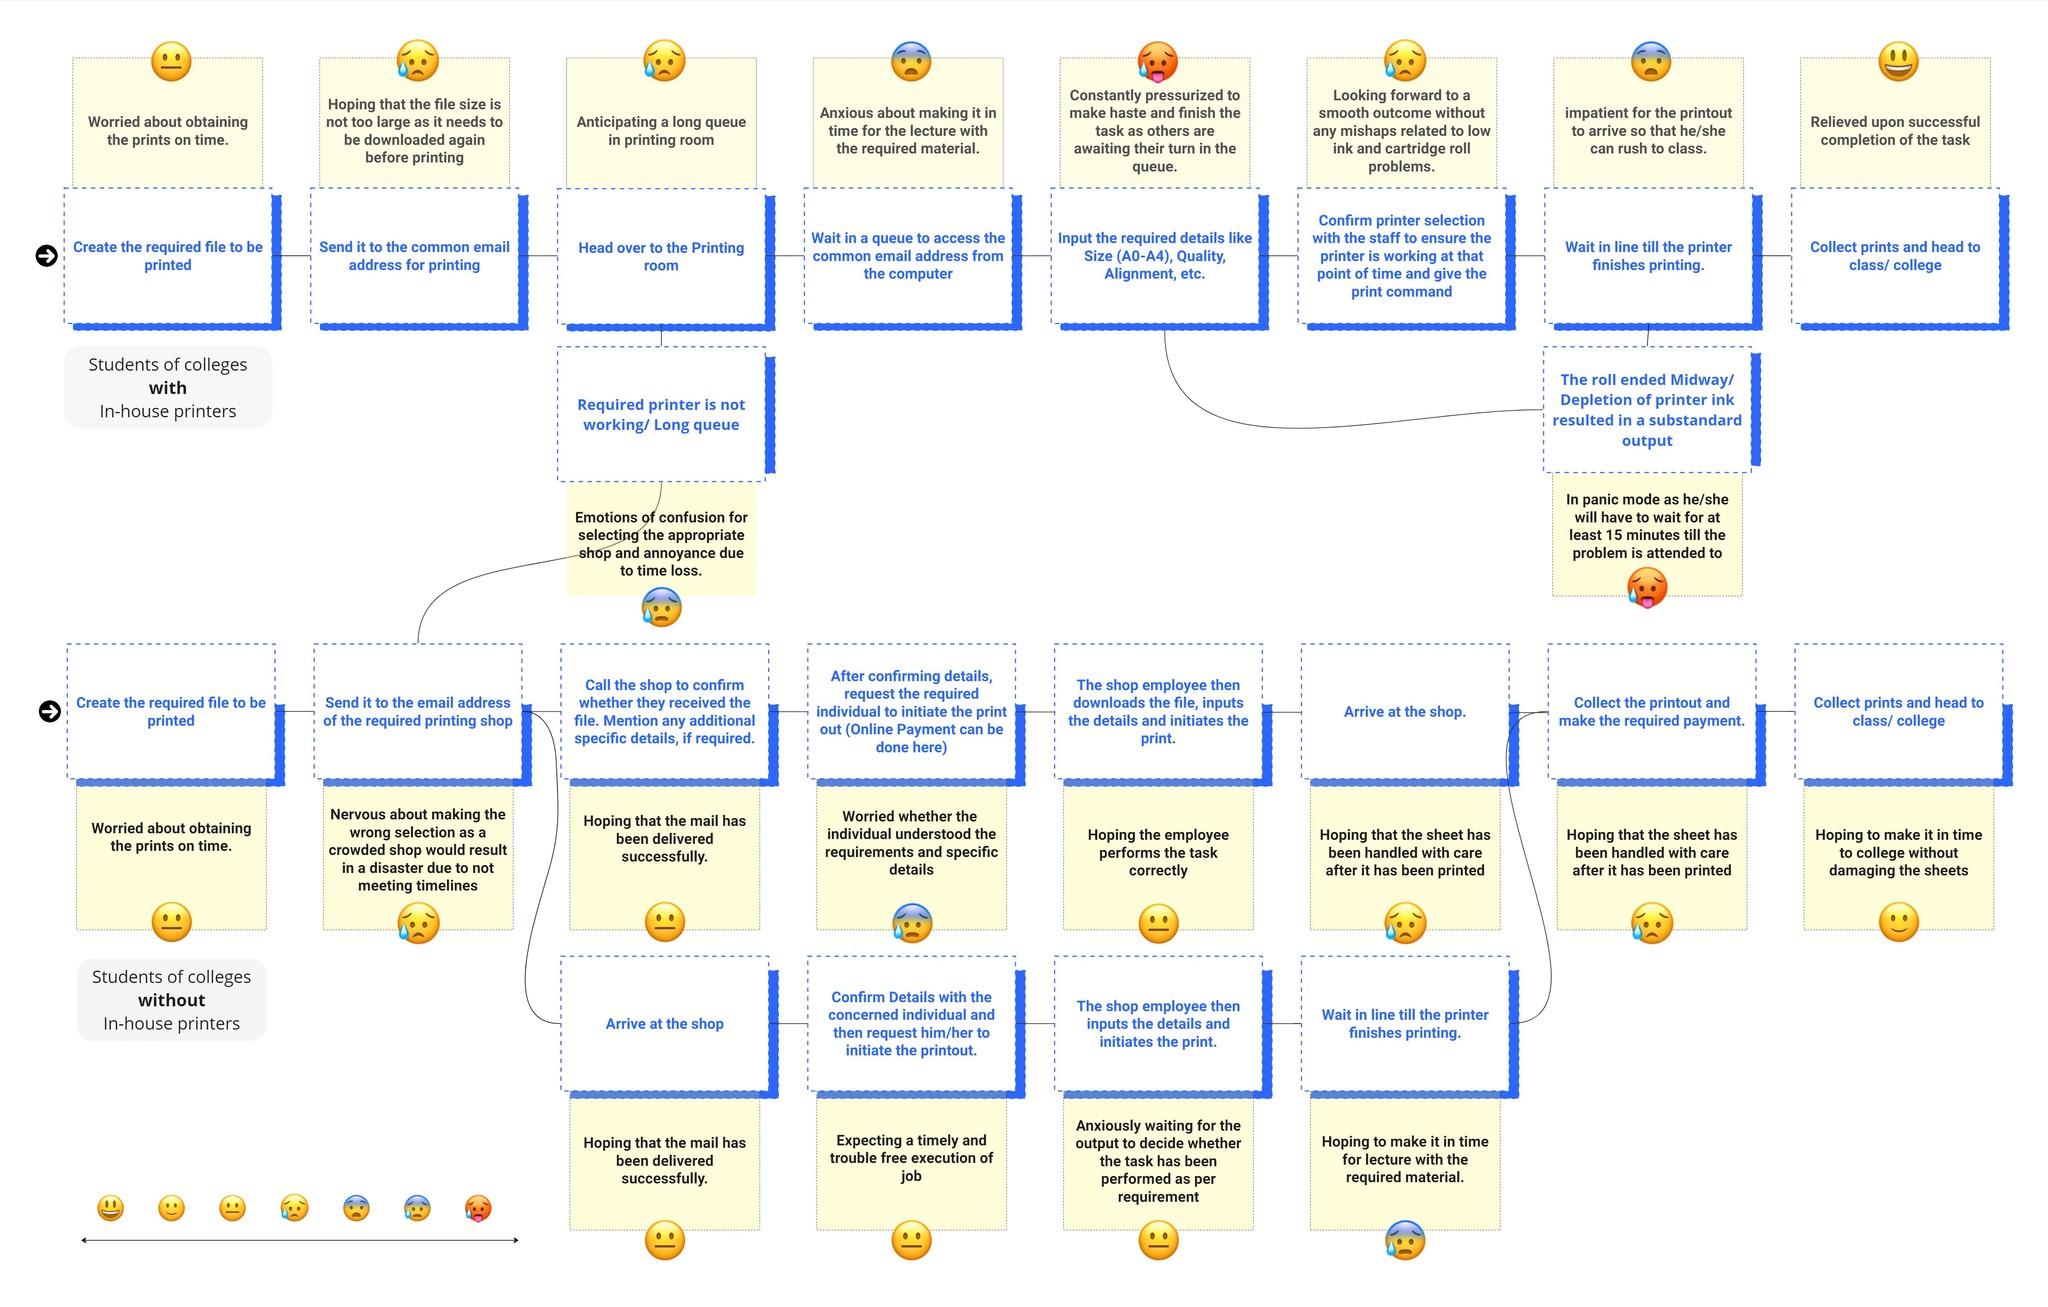
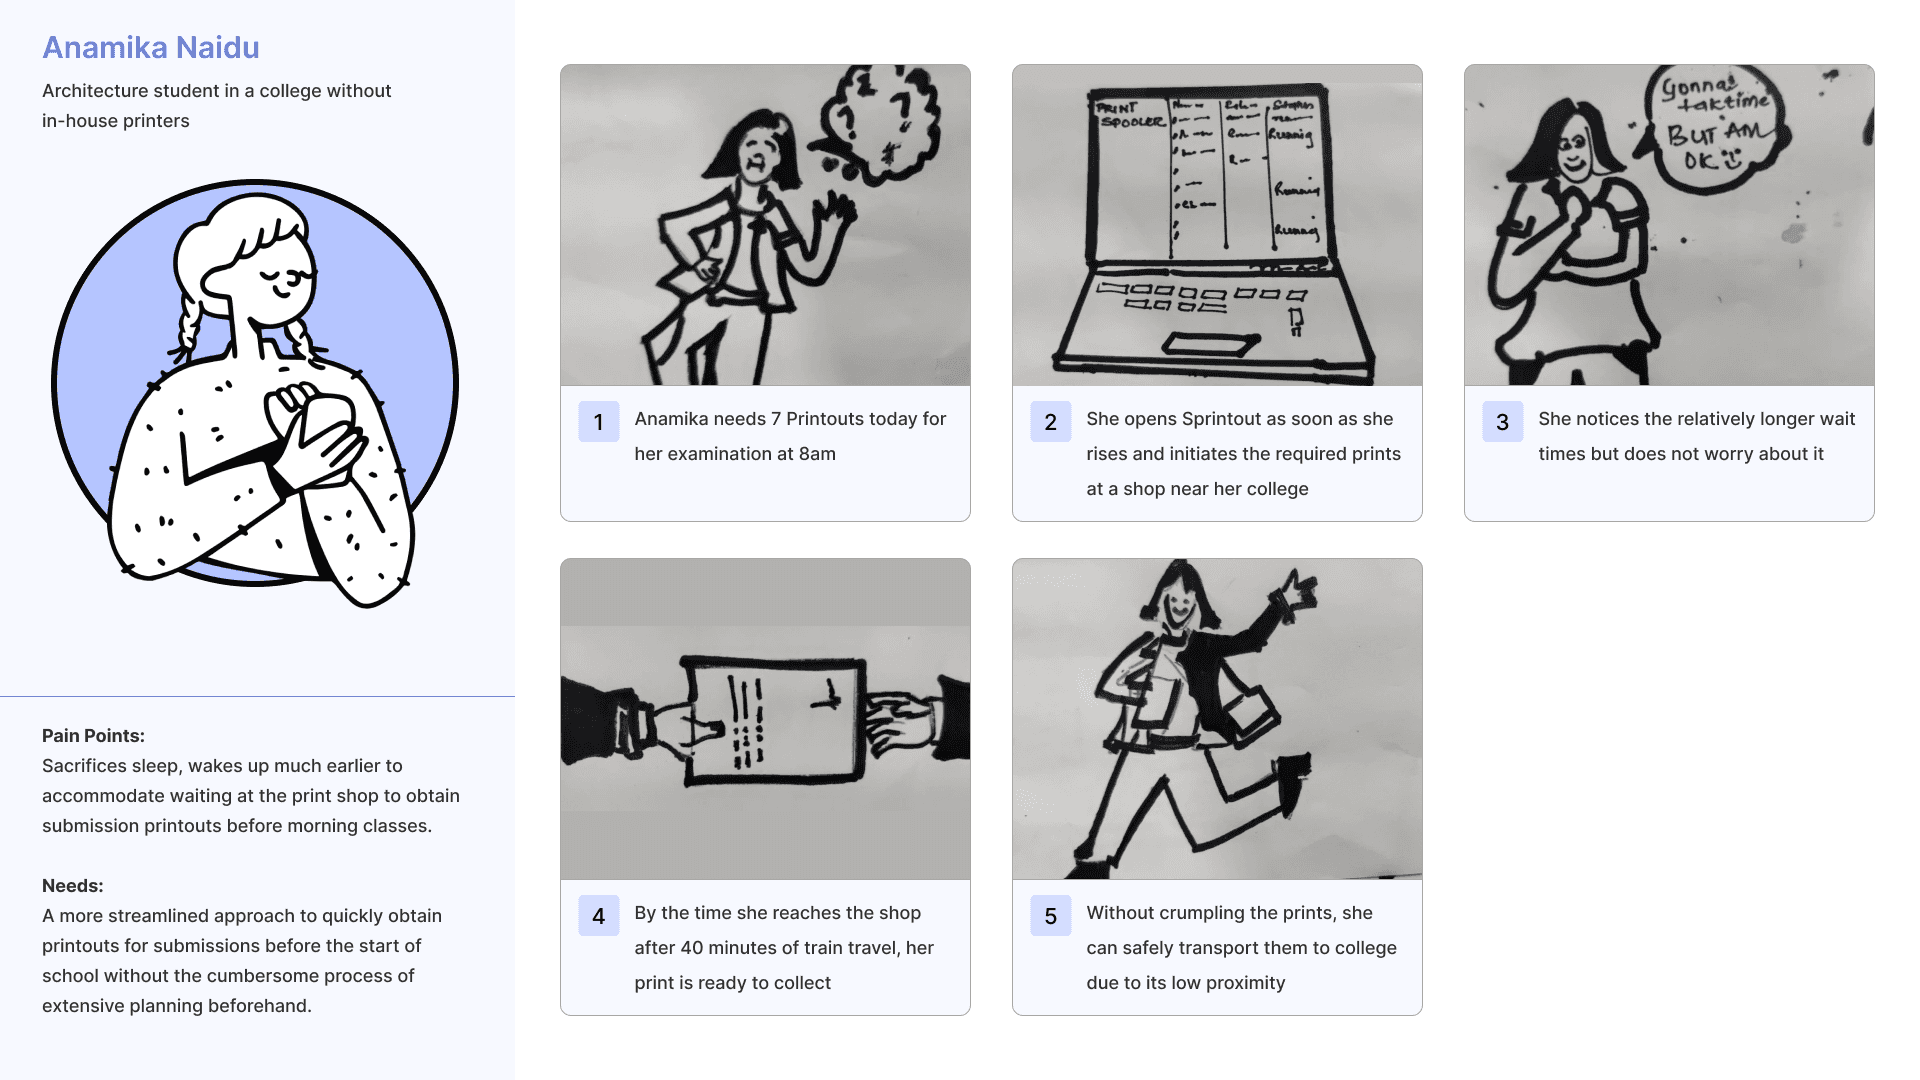
Students of Colleges without In-house printers (Bottom)
Collective Journey map of Students
IMAGE
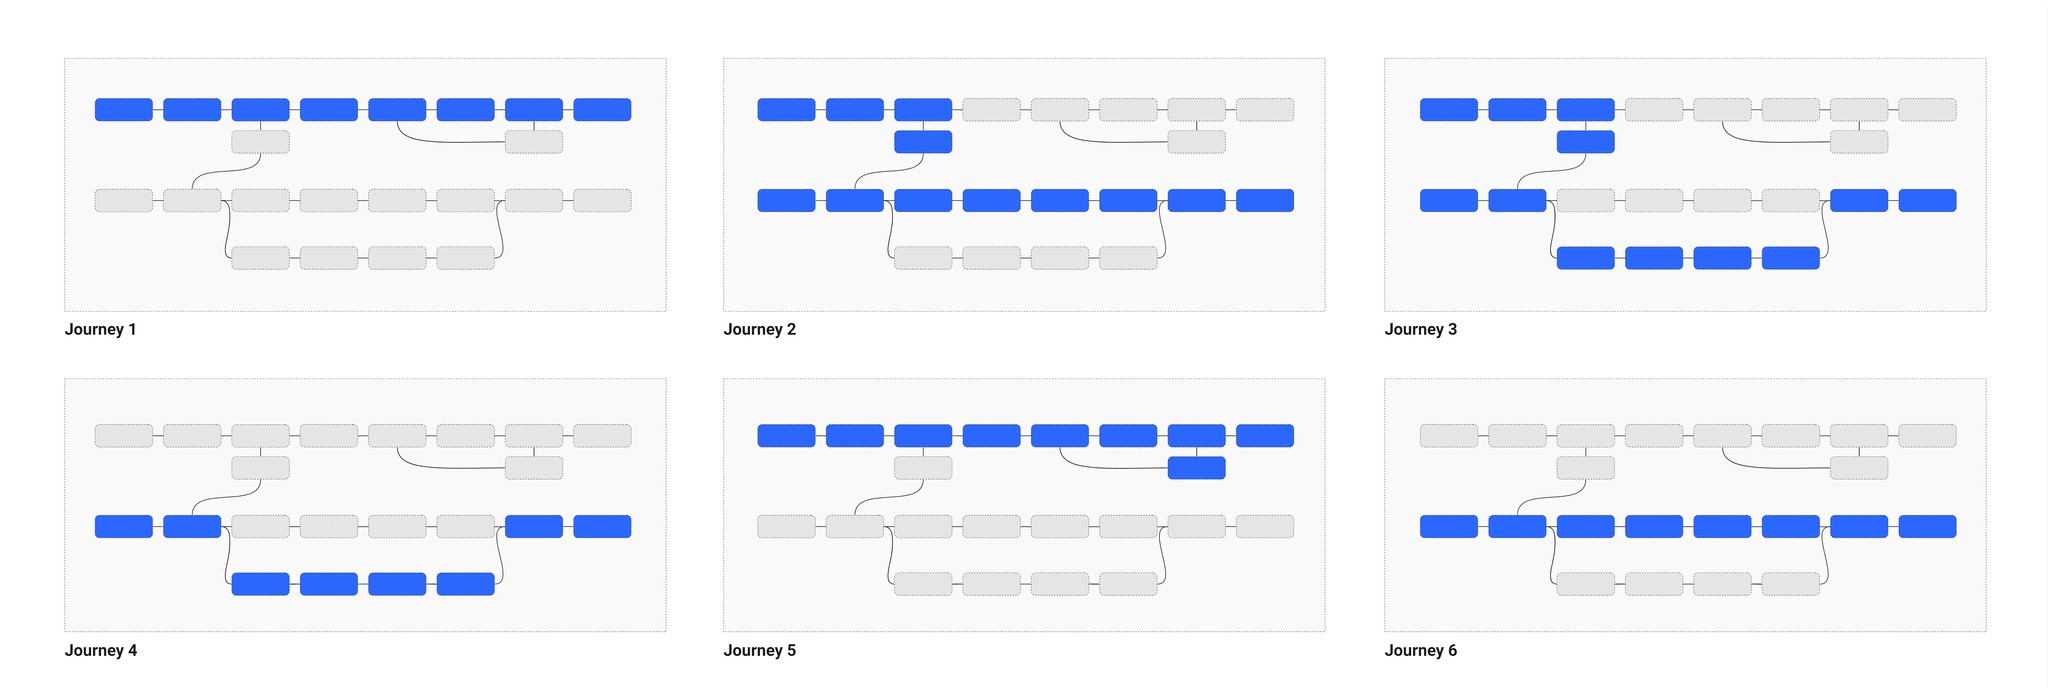
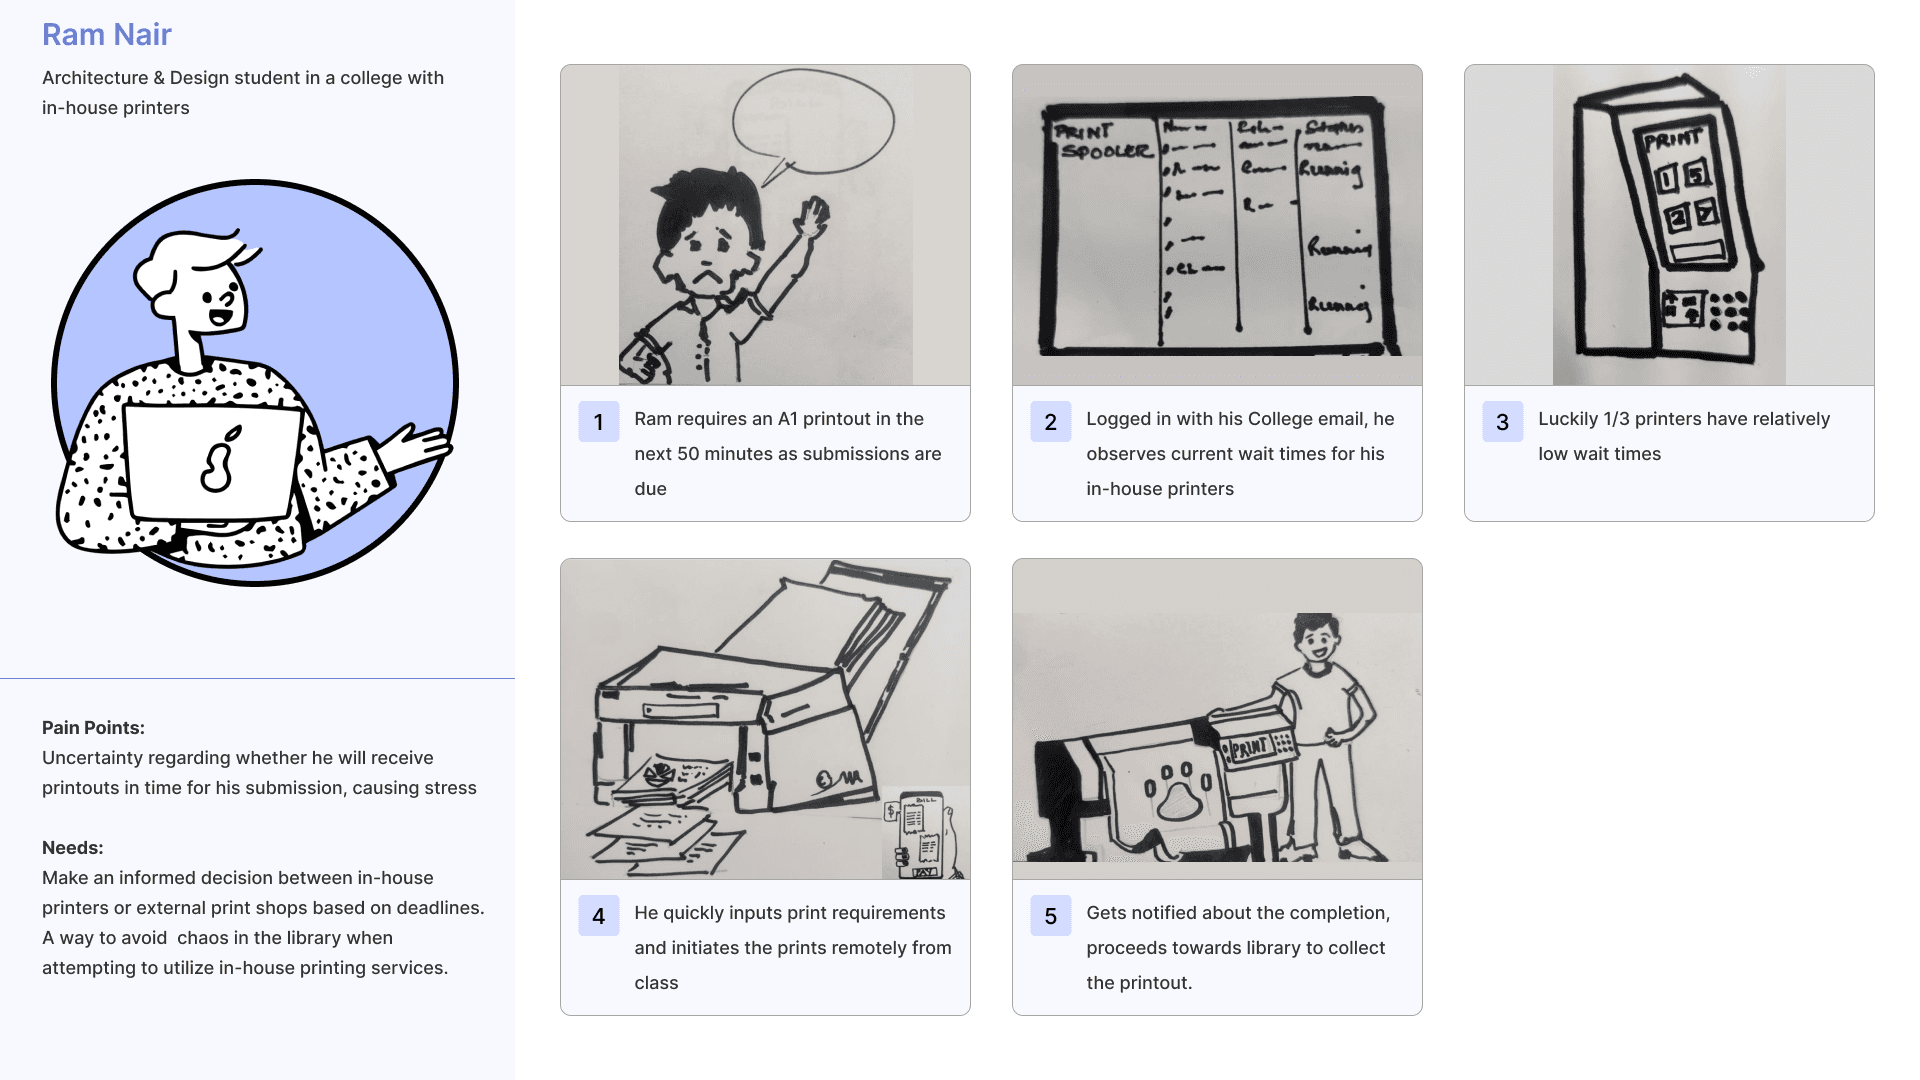
Individual Journey map of 6 participants consisting of 4 students from colleges with in-house printers and 2 students without in-house printers
IMAGE
.
Please note,
Case 1: Students of Colleges with In- house printers
Case 2: Students of Colleges without In-house printers
TAKEAWAYS
Repetitive tasks, lack of control over print execution, and the worry of obtaining timely printouts
.


In both cases, the entire journey of obtaining a printout consisted of multiple, repetitive steps.
A user specifies multiple details pertaining to his printout via email or calls to the print shop employee. This same information has to be inputted again in the system by the employee while giving the print command.

The responsibility to perform the ultimate action of giving a print command was not executed by the customer but by the employee of the shop.
This occurred in Case 2, and made the customer nervous as they were NOT the initiating authority and needed to rely on someone else.

Students were extremely concerned about the potential long queues and wanted the best output as quickly as possible with minimum expenditure.
In case 2, Students were forced to take their best guess regarding which shop had the least crowd before sending their print files to a particular shop and hope for the best.

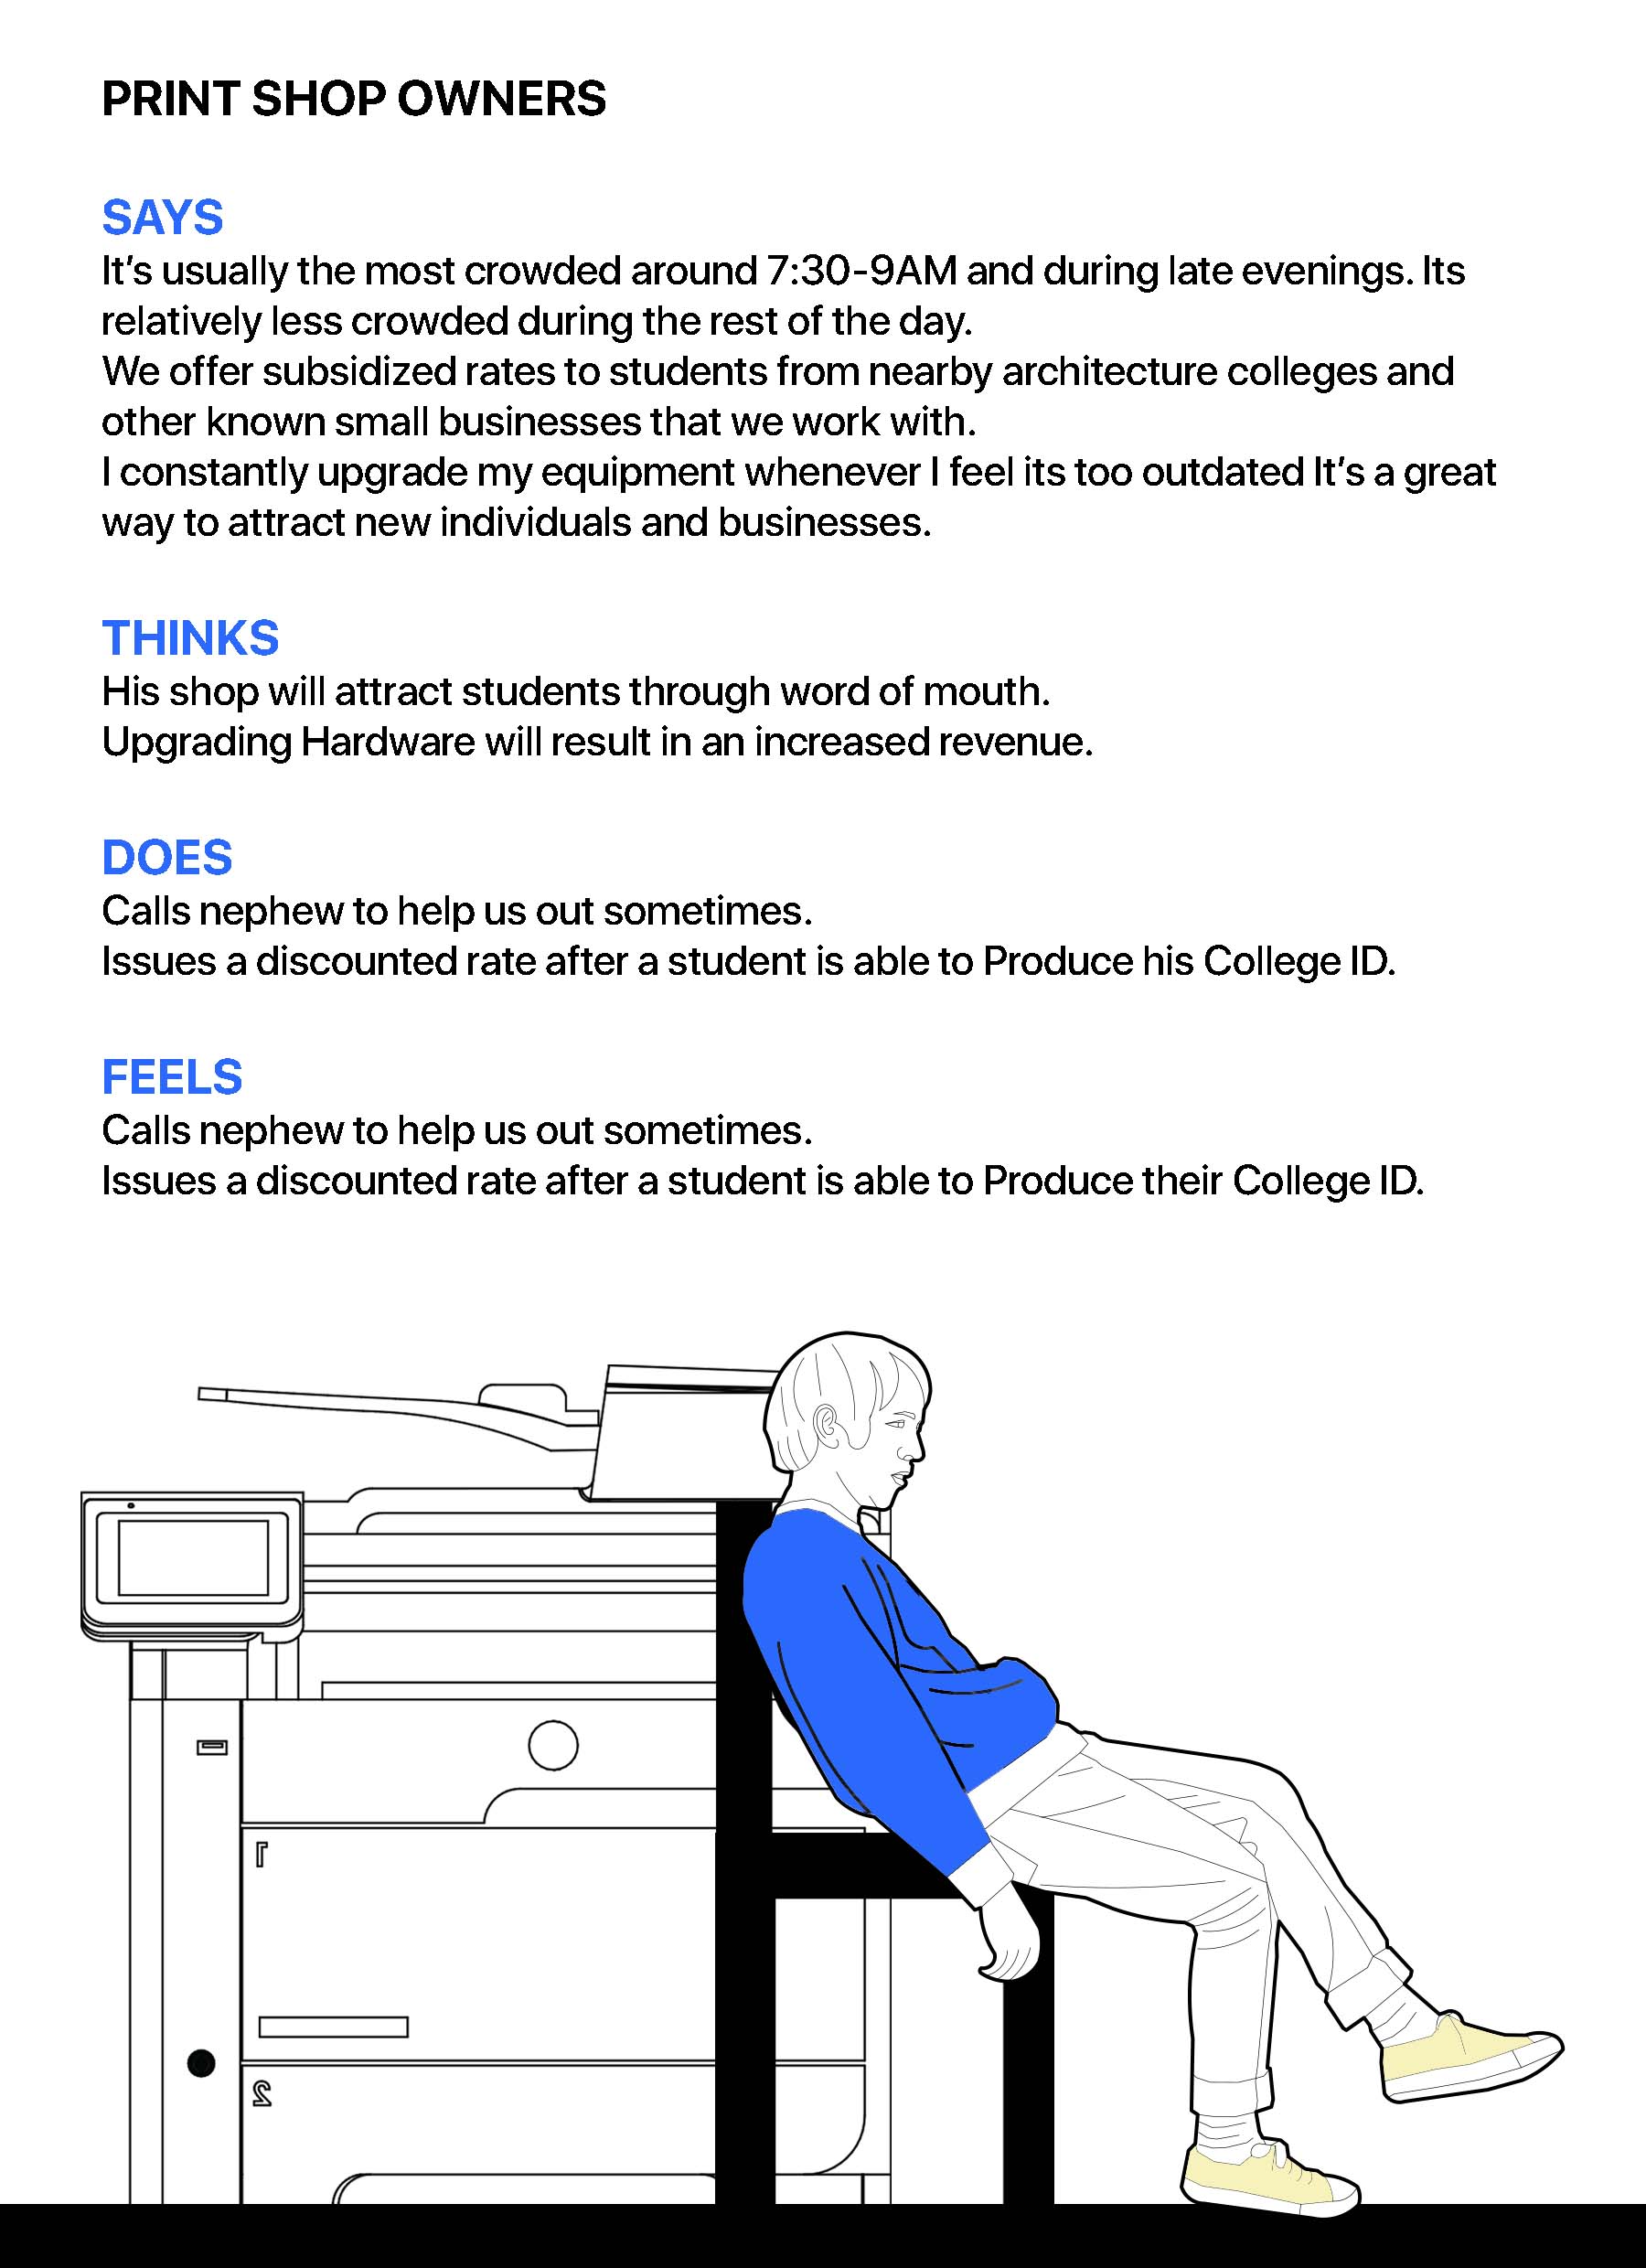
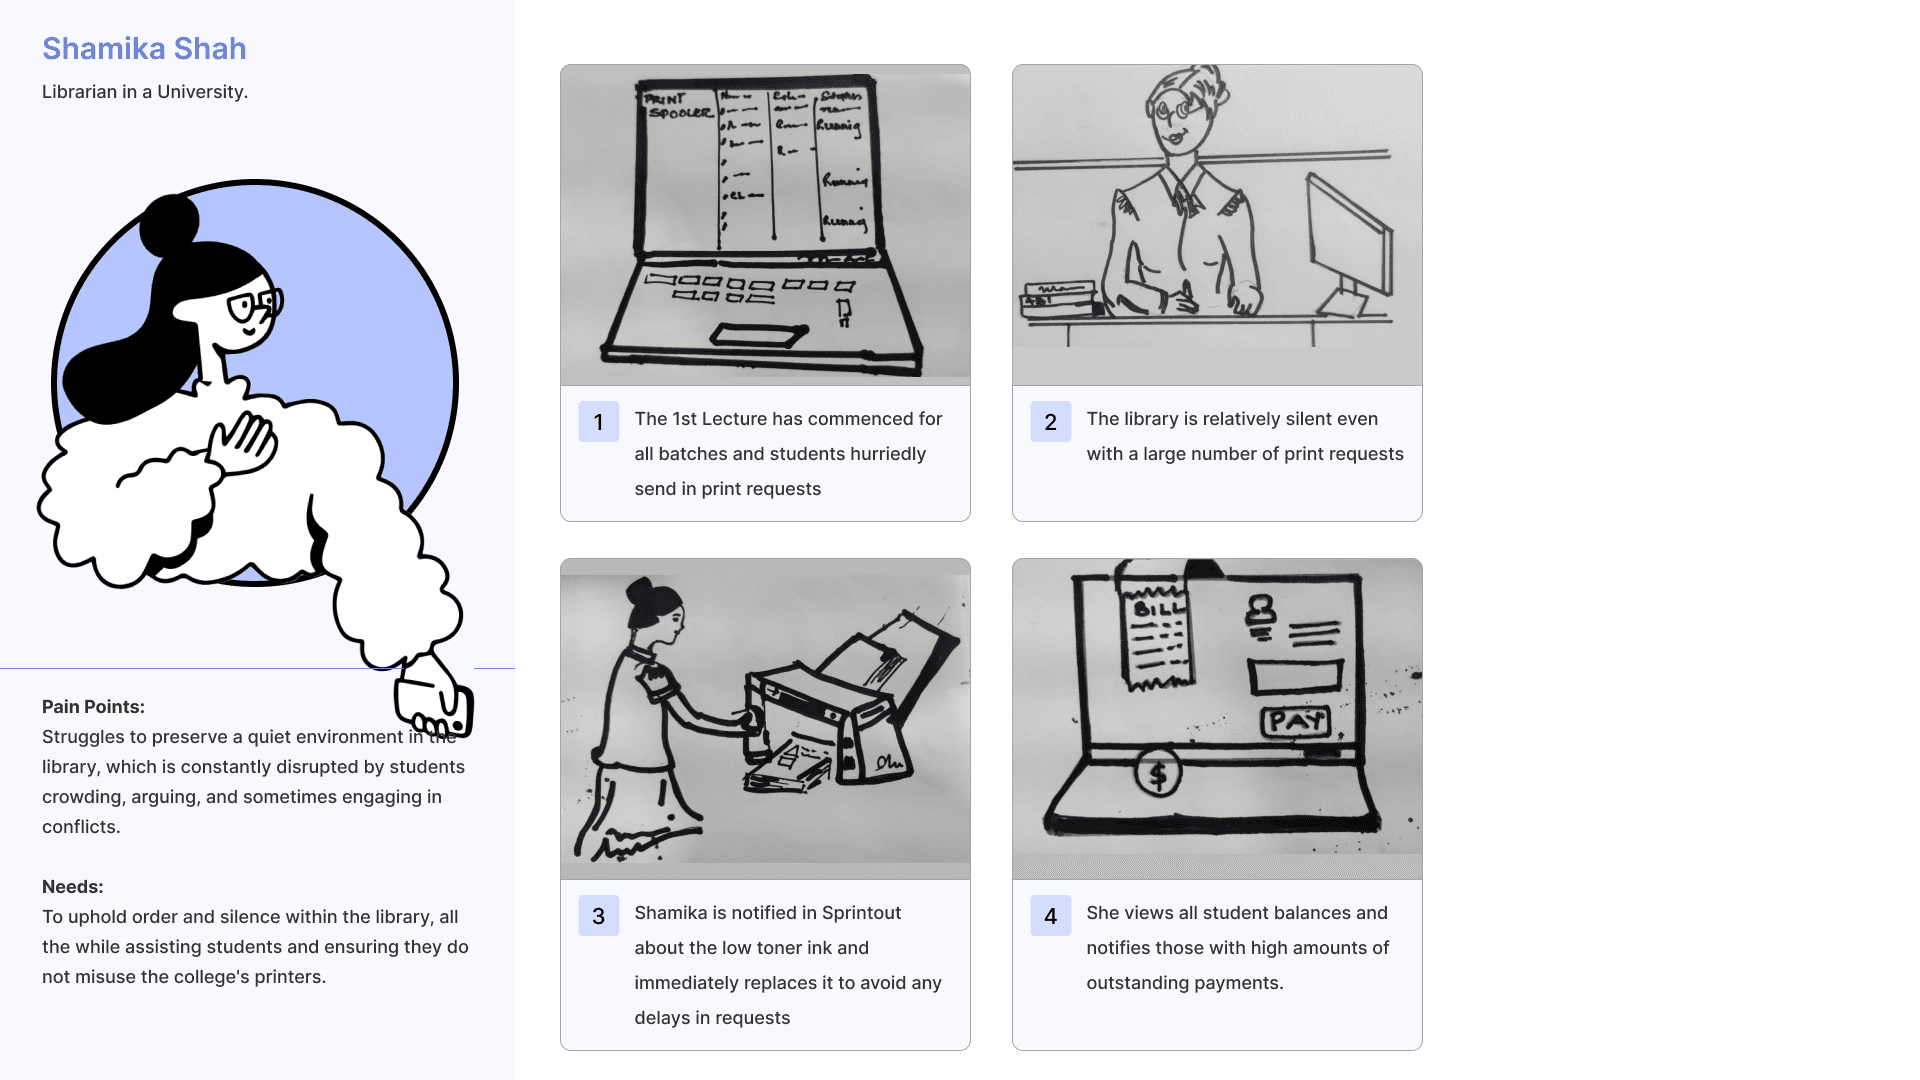
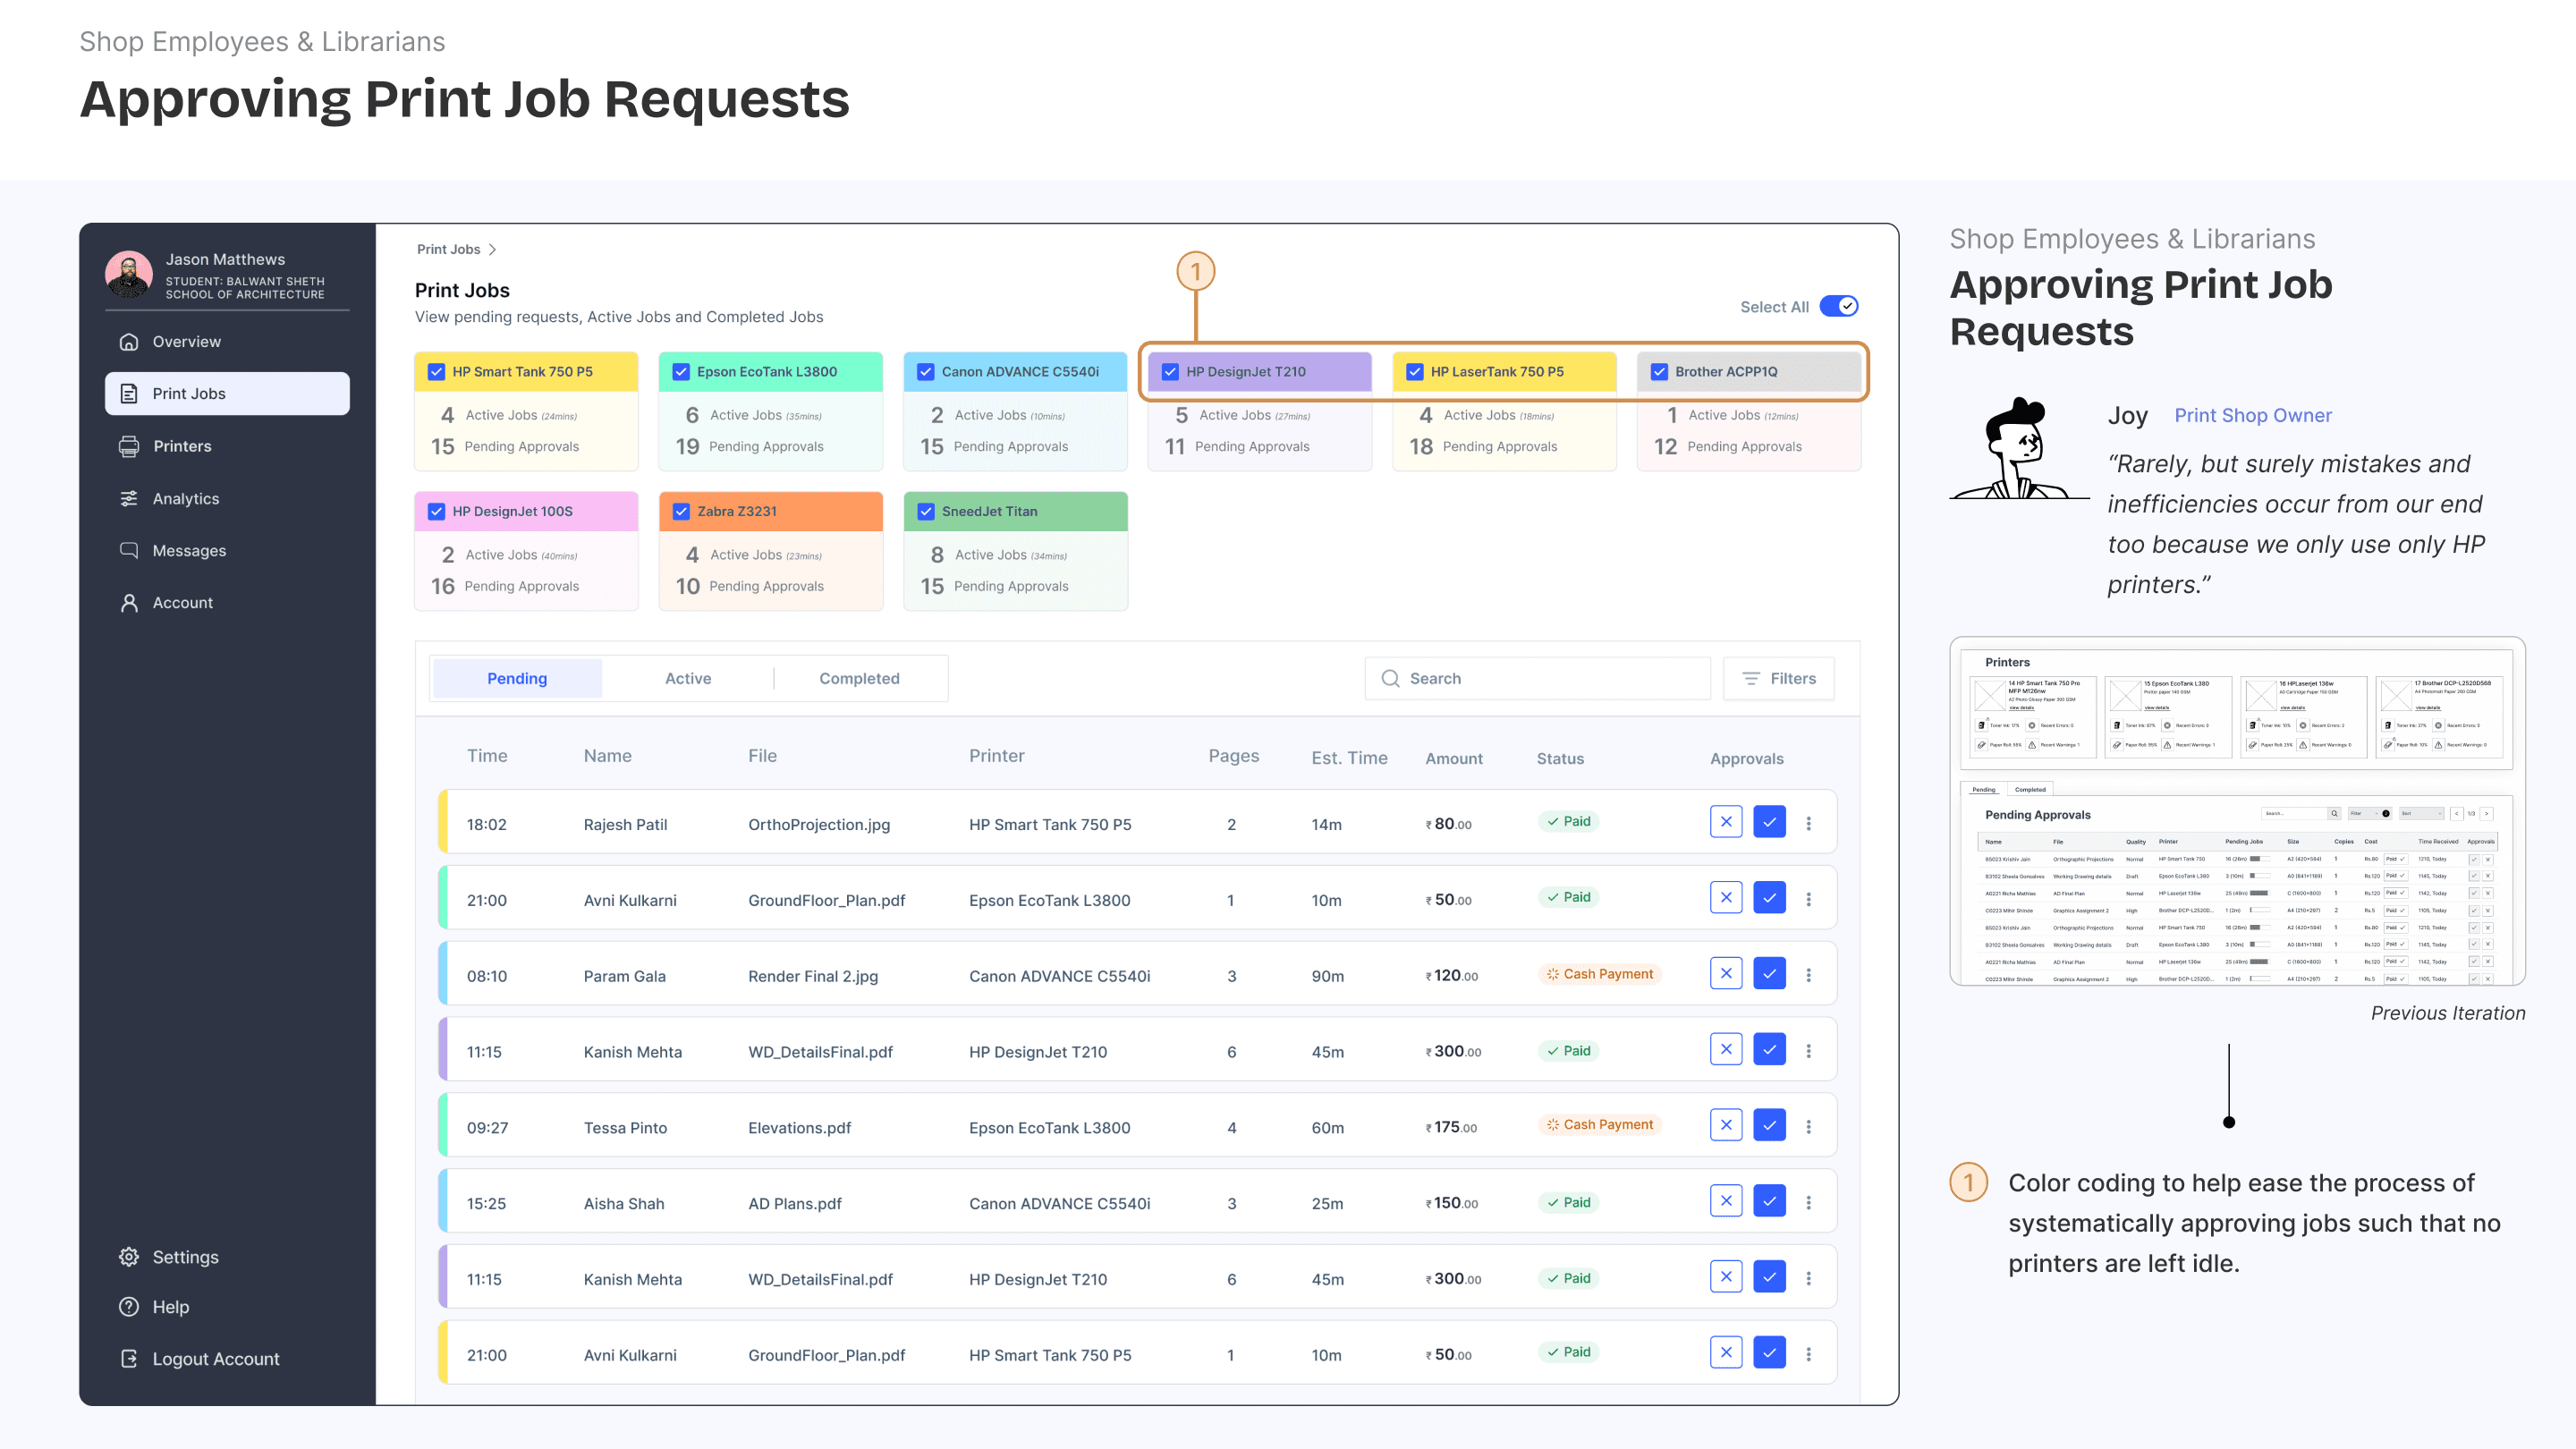
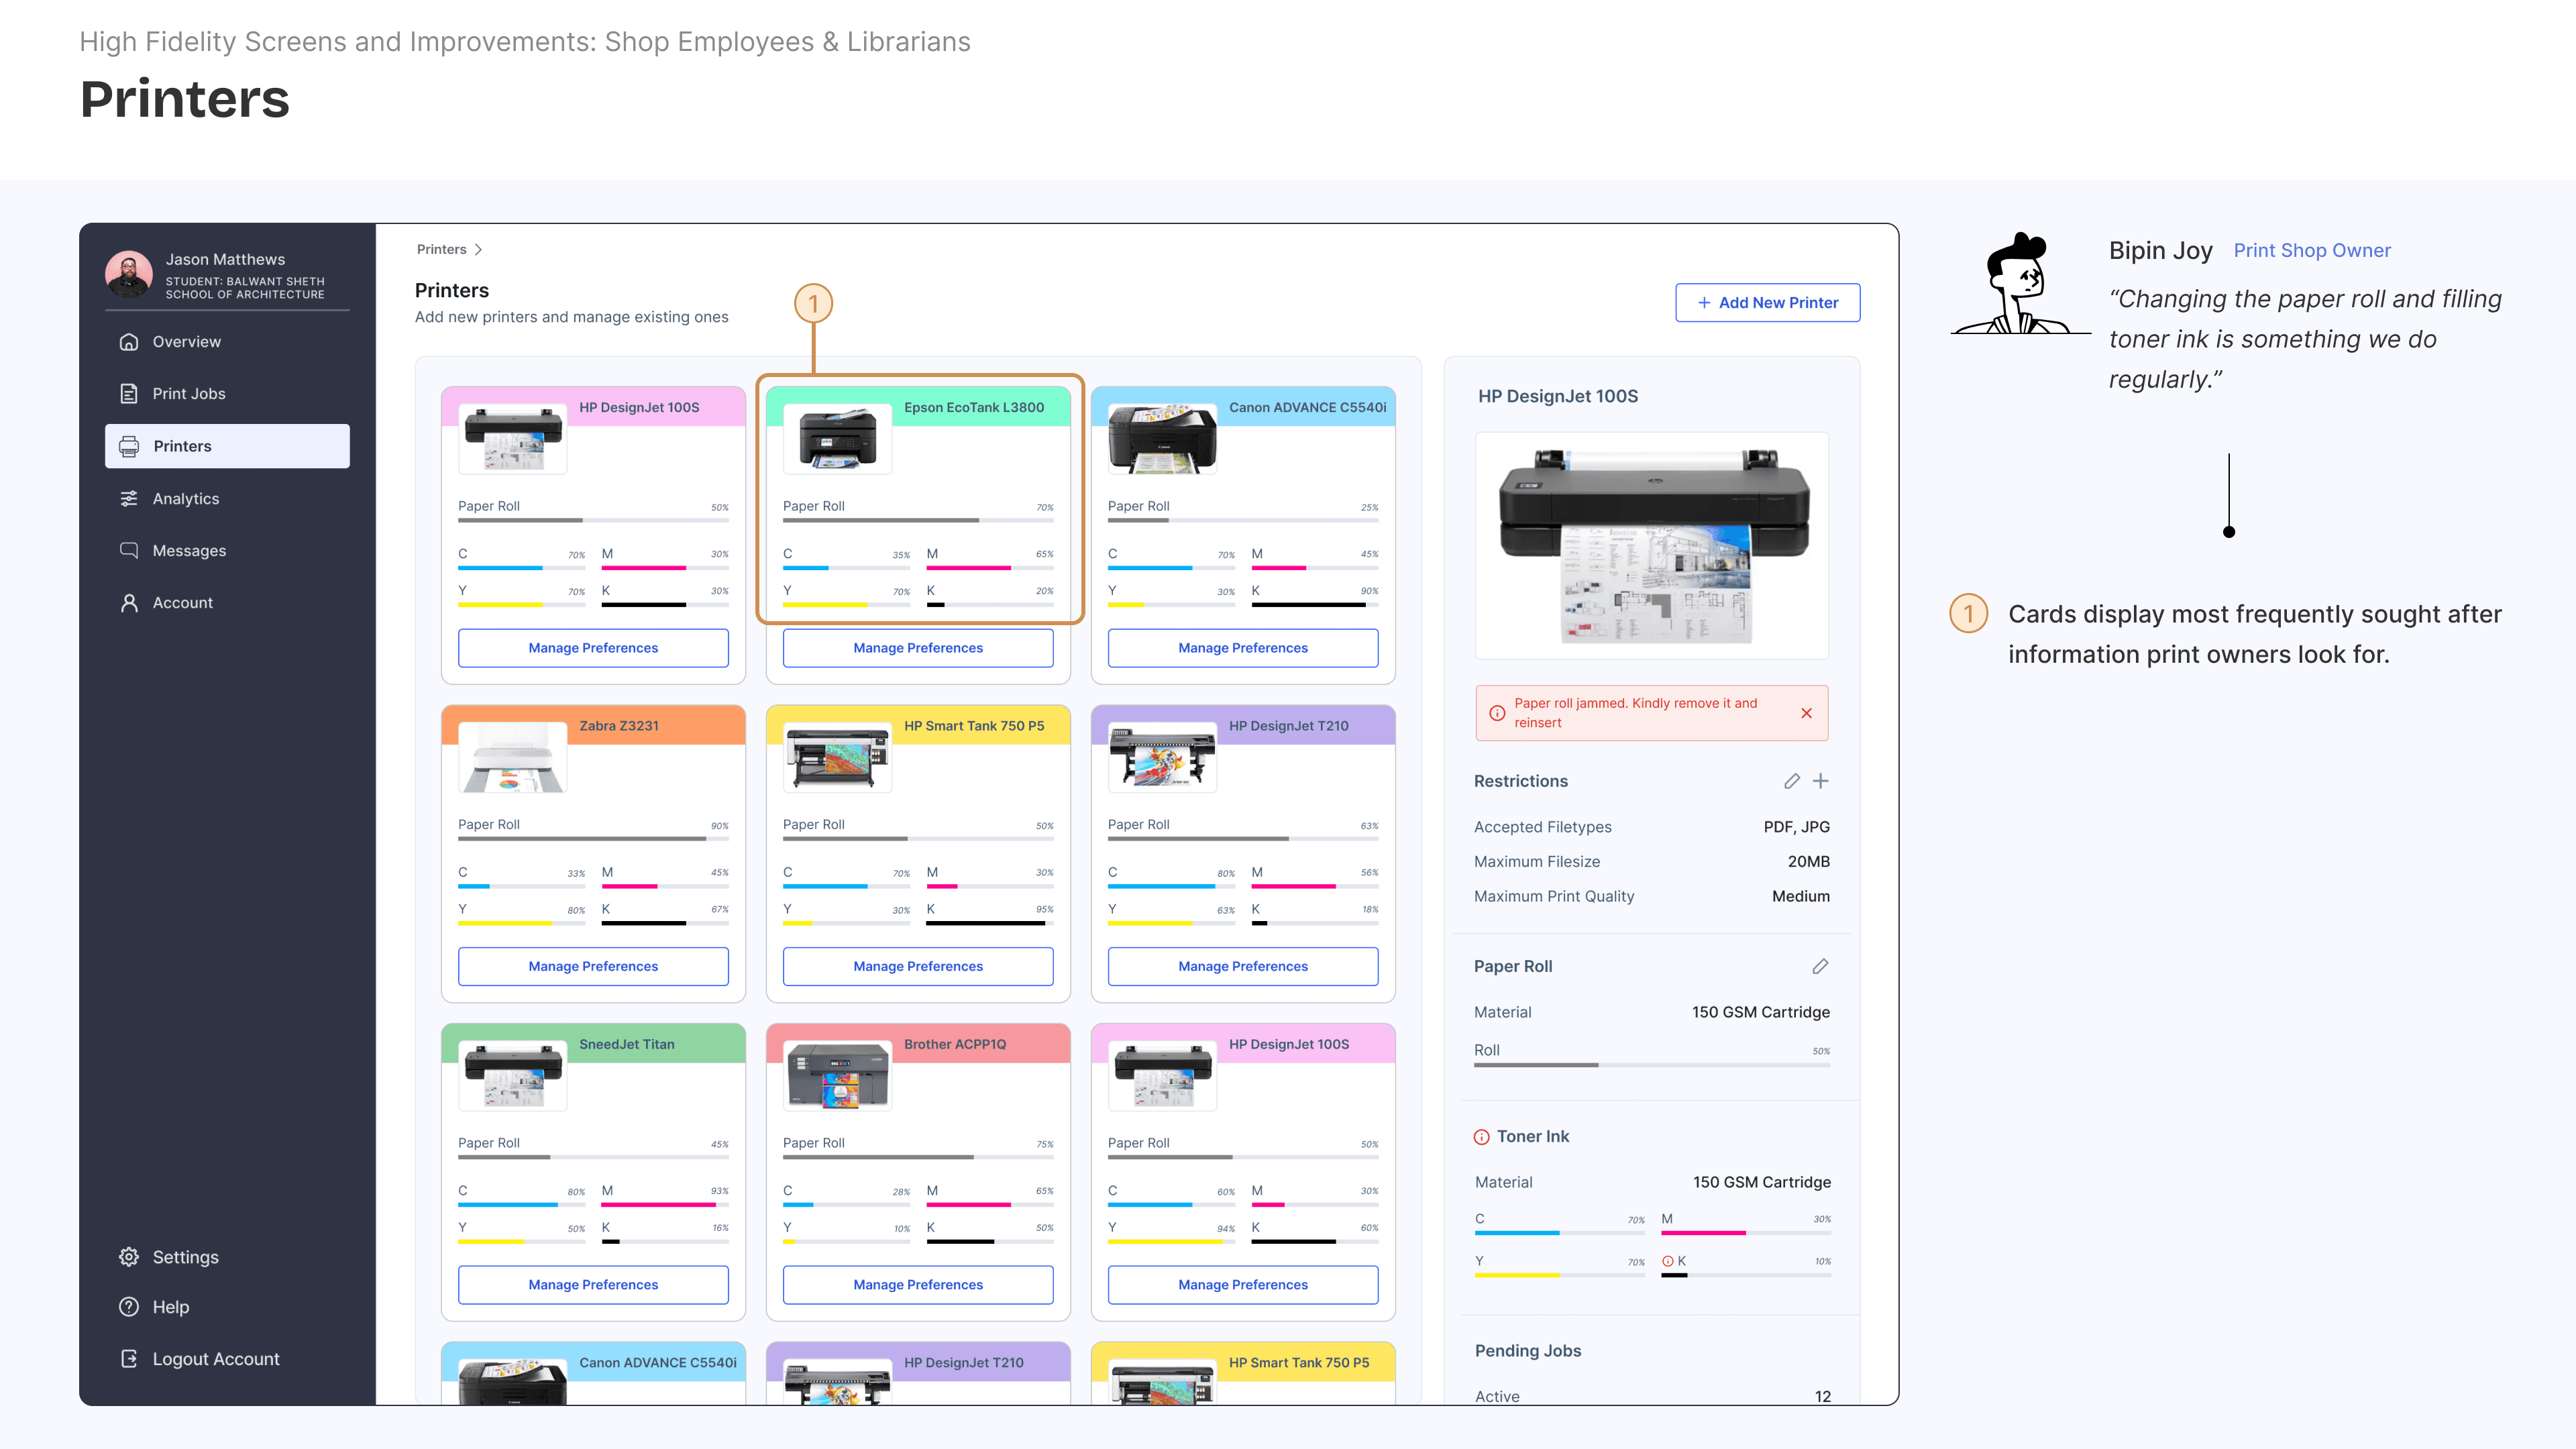
USER RESEARCH: PRINT SHOP EMPLOYEES AND LIBRARIANS
What's the latest in the printing industry and how do its employees operate?
.
Next, I proceeded to understand the perspectives of different stakeholders involved in the process. Before I approached them, I began my desk research by understanding the dynamics of running and maintaining a printing service. I looked into reports compiled by Heidelberg and Darrel Amy to find answers to the following.

What is the current state of this industry and what lies ahead?
What hardships do owners encounter when it comes to scaling the business?
What are the major factors that can make or mar your service?
What opportunities exist and what do existing solutions look like?

KEY LEARNING
In most cases, productivity in the average print environment is between 20-40%. A large part of the potential isn’t being utilized. Improving productivity by around 20% lays the basis for increasing profits by around 50%.
.
The data also shed light on a 6 strategies to direct future growth to ensure long term growth and success:
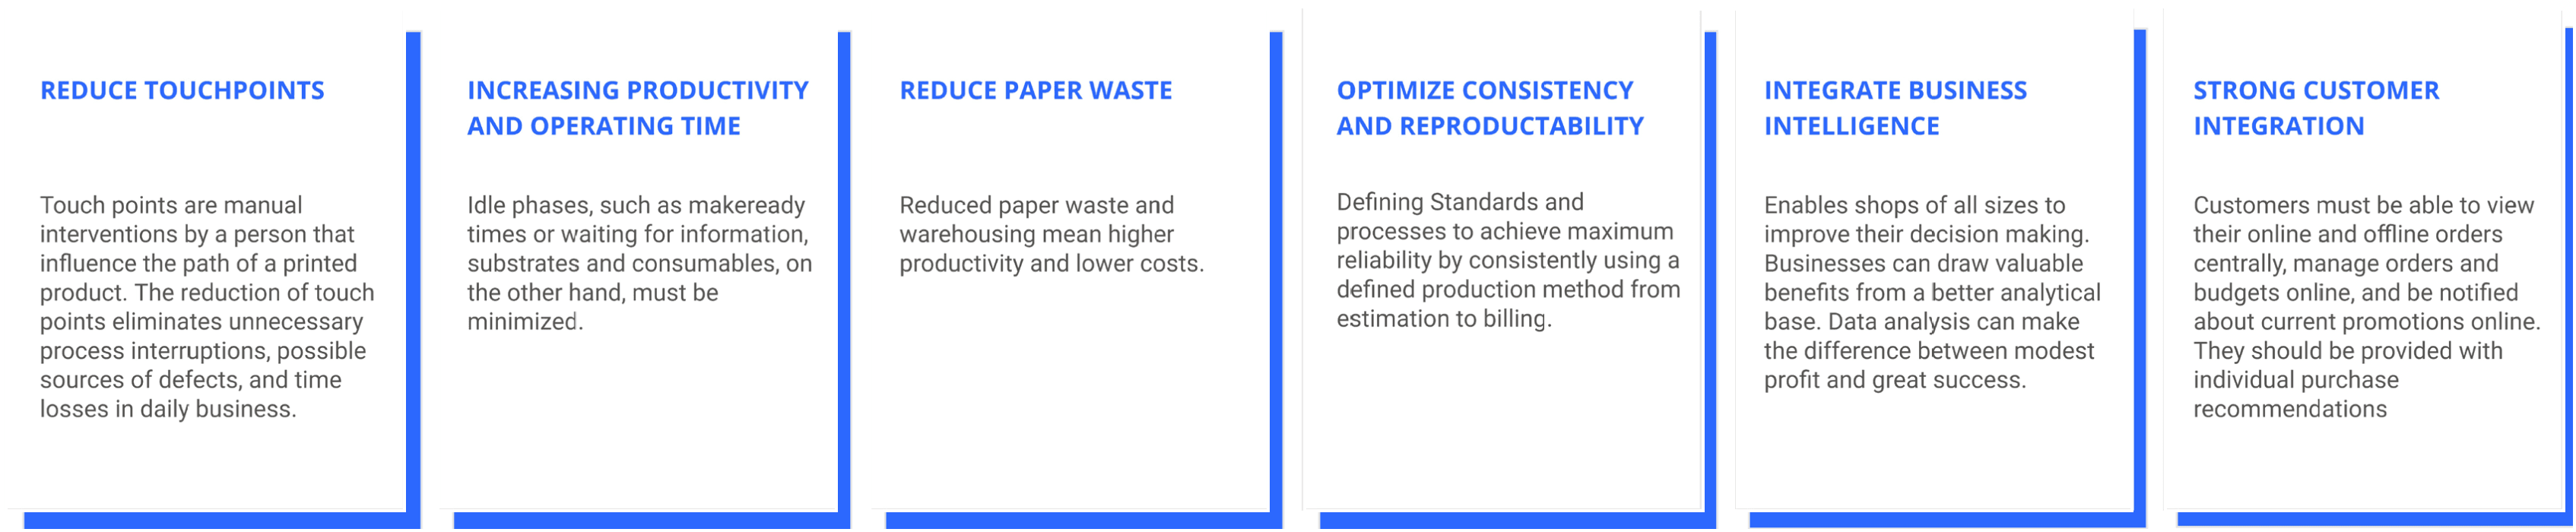
6 strategies to direct future growth:
IMAGE
.
I proceeded to understand the degree to which people managing printing services were aware of, or had implemented certain strategies within their printing space. I visited 2 colleges with in house printers and 2 local shop owners.
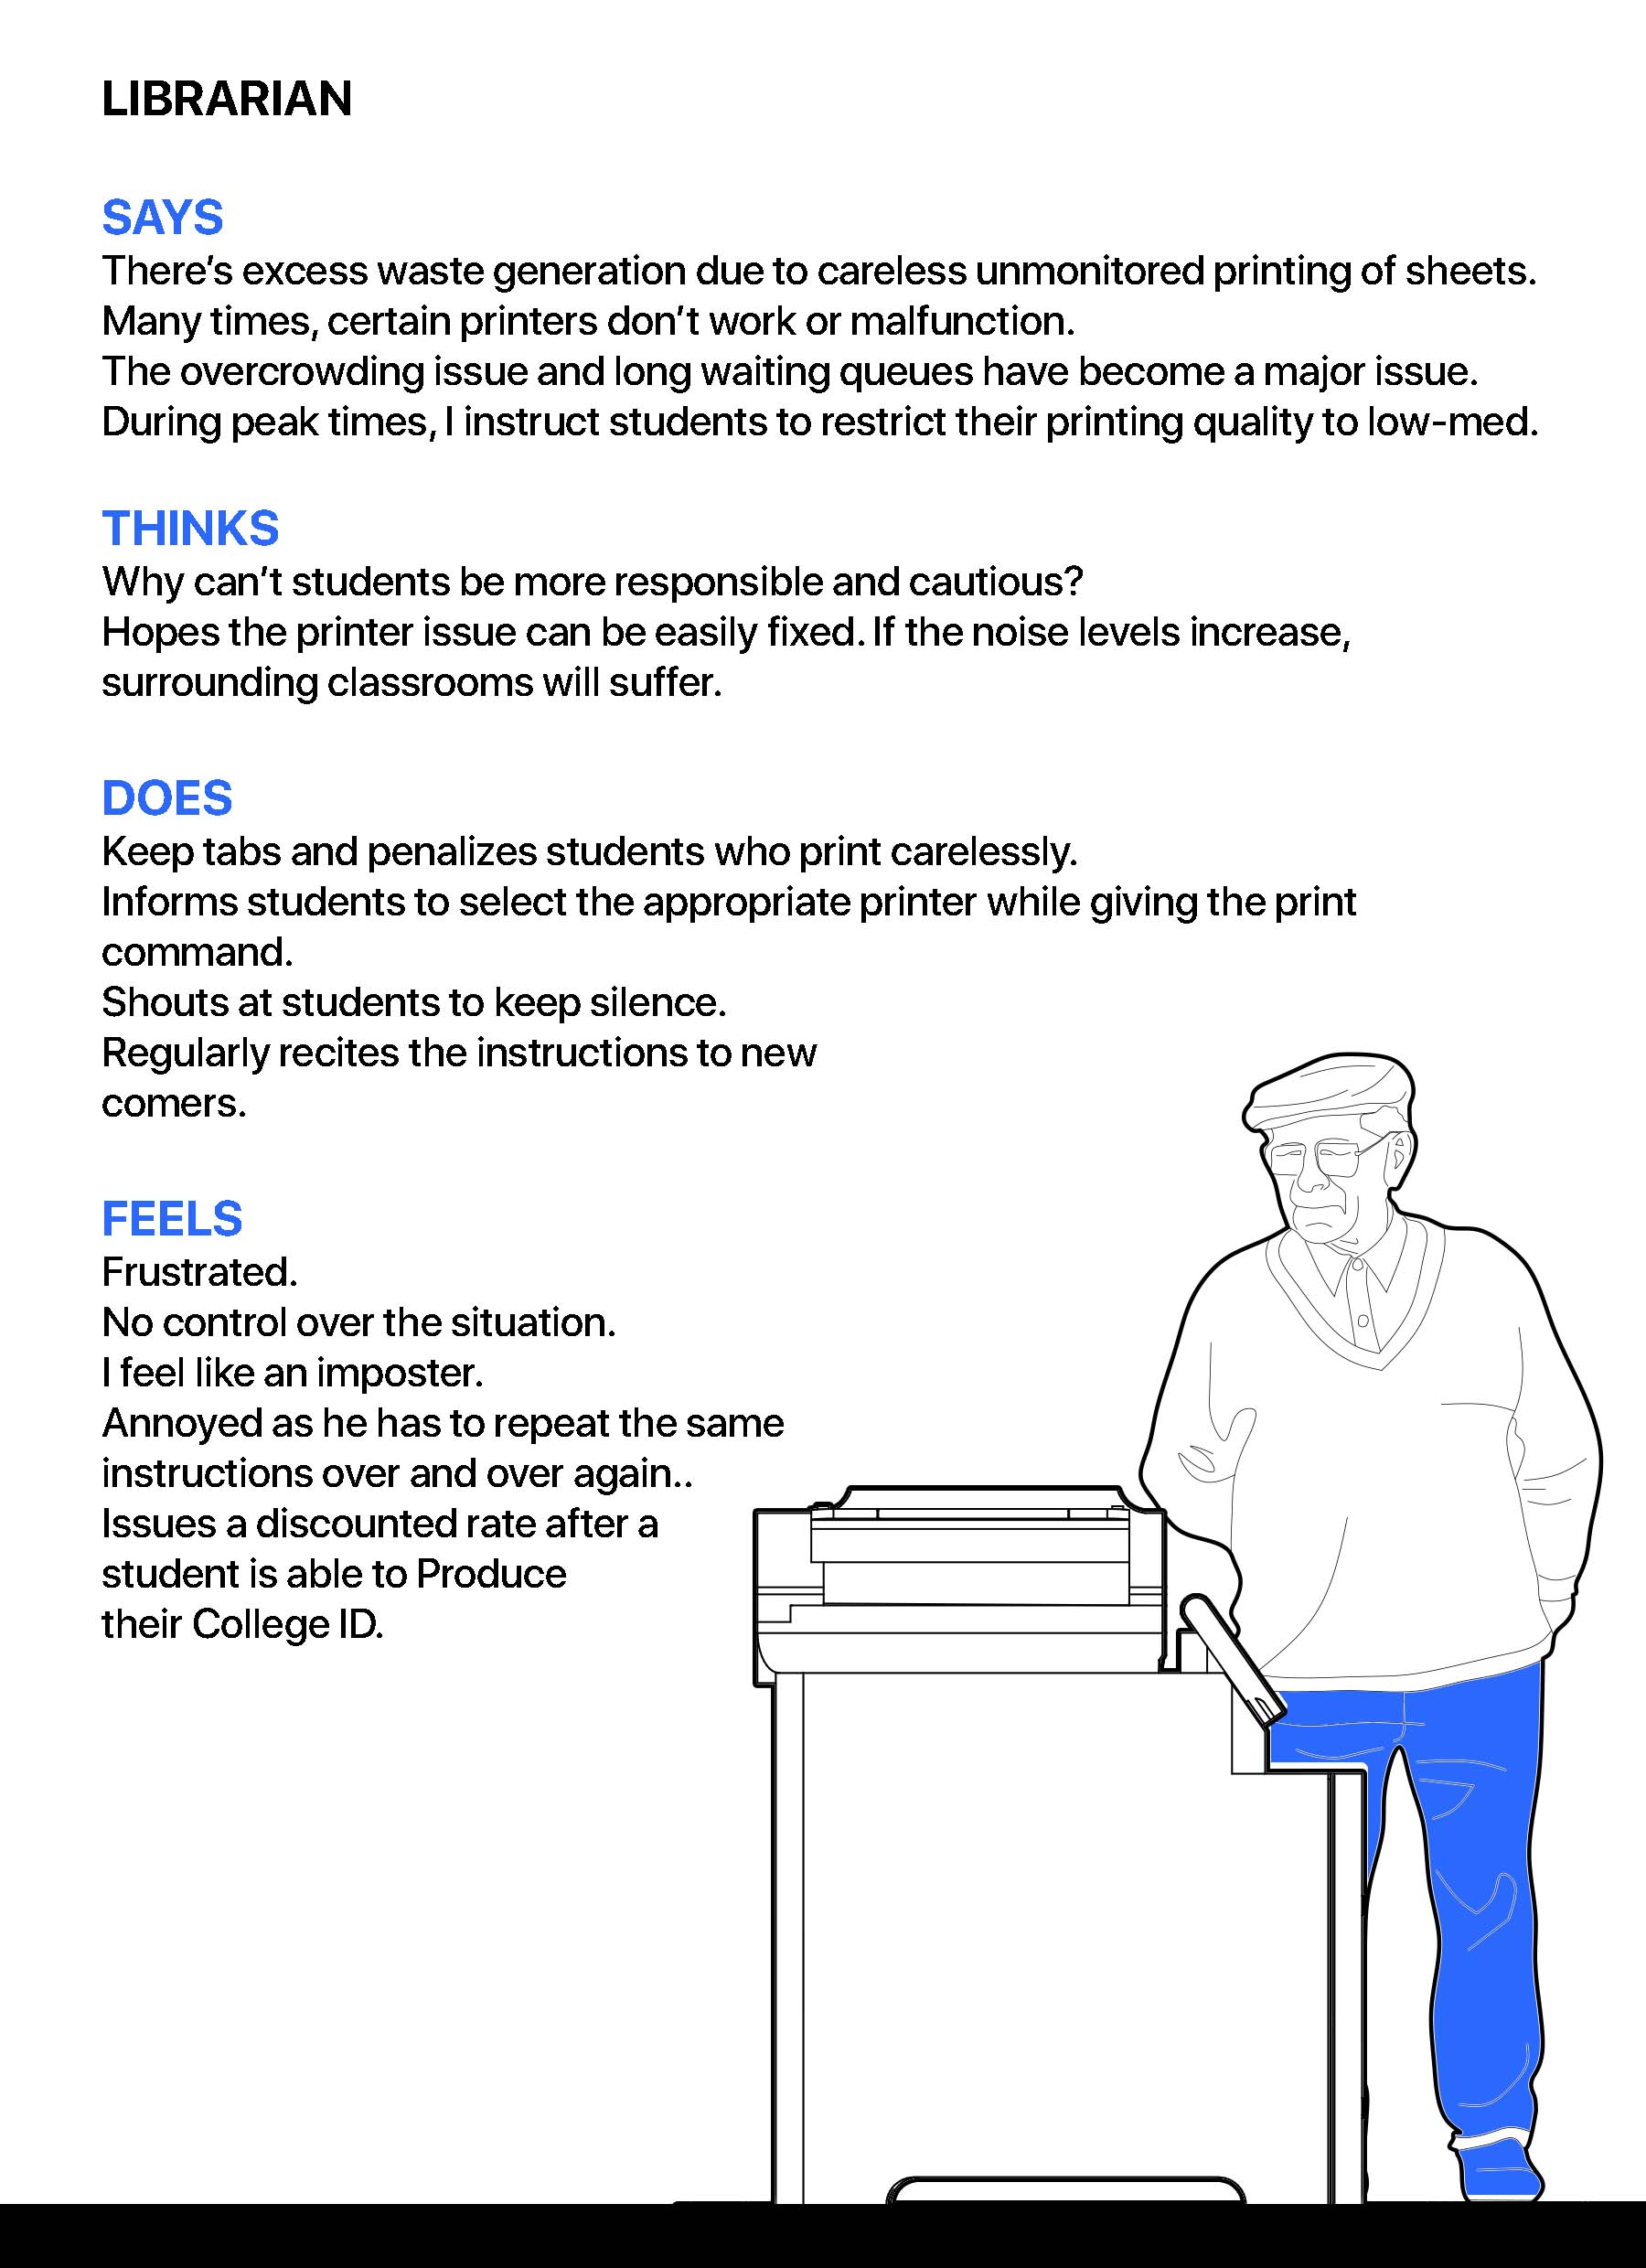
TAKEAWAYS
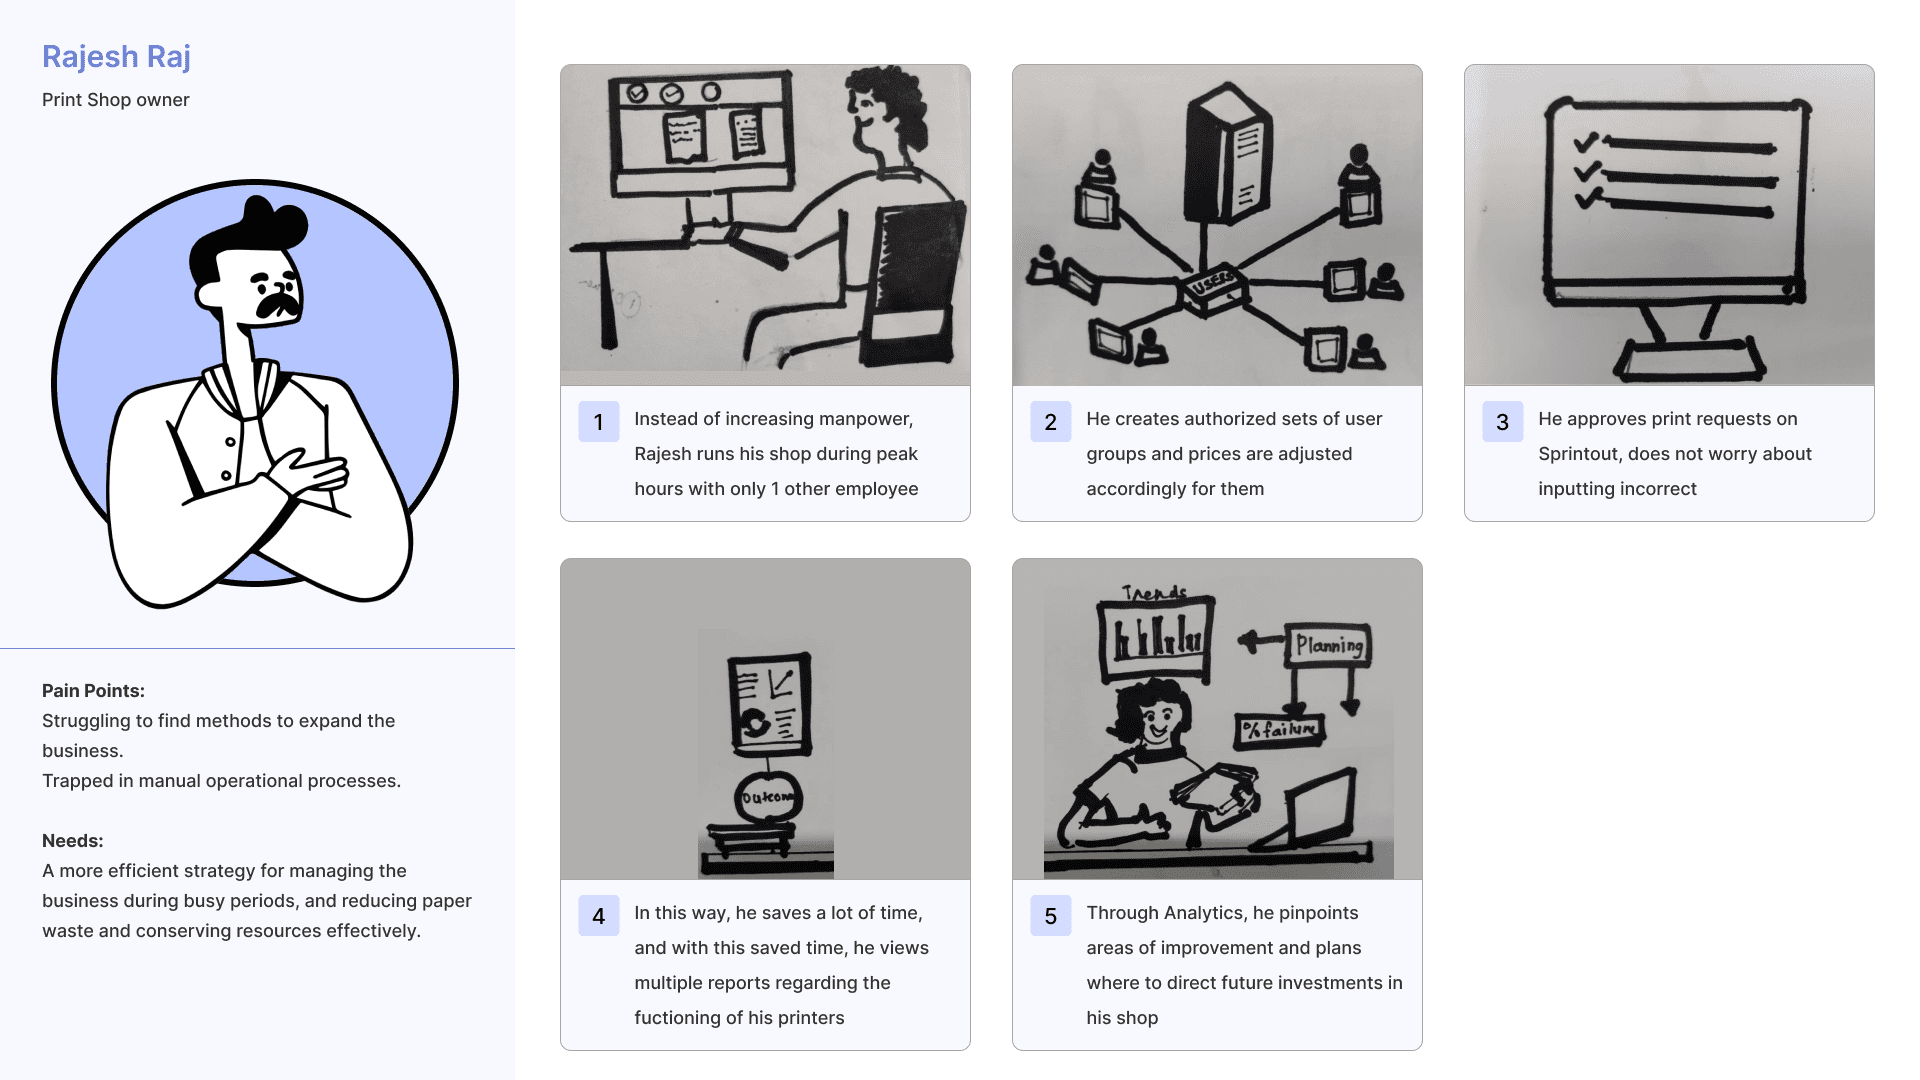
Increased demand meant: (1) Purchase faster Printers (2) "My son will skip school to lend a hand at our shop"
.


When printing jobs increased exorbitantly, shop owners increased manpower to cope with the load.
These services are in high demand during specific hours and at a plateau during the rest of the day. Increasing manpower was a short term solution that was momentary and did not address the long standing problem.

For 3/4 owners, scaling up the business & enhancing their service meant investing in printers with greater speeds and better outputs.
All the interviewed individuals kept manual book records of inventory and did not utilize the collected data to direct future investment in the business
TO SUMMARIZE
There's potential for mutual benefit by connecting the dots.
.
The root cause of the problem lay in the inability of students to predict the waiting time to obtain a print, leading to uninformed decisions based on guess work and probability.
Individuals responsible for running the printing service relied heavily on traditional and manual methods of operation that ultimately led to inefficiencies, slowdowns and a lesser output. These problems got magnified during peak hours

DESIGN OPPORTUNITY
How might we optimize processes in printing environments to empower students to obtain quality printouts in a timely manner.
.
After arriving at a statement I was happy with, I moved on to the ideation phase. At this point, I believed I had a good understanding of the functioning and role of each stakeholder. I did a storyboarding session with these individuals to validate what I had in mind.
IDEATION 1.1
Reduced wait times at printing locations, informed decision-making and greater control as the initiating authority.
IDEATION 1.2
No more rushes, long queues and prolonged downtimes
IDEATION 1.3
Significantly reduced manpower; analytics to drive future growth.
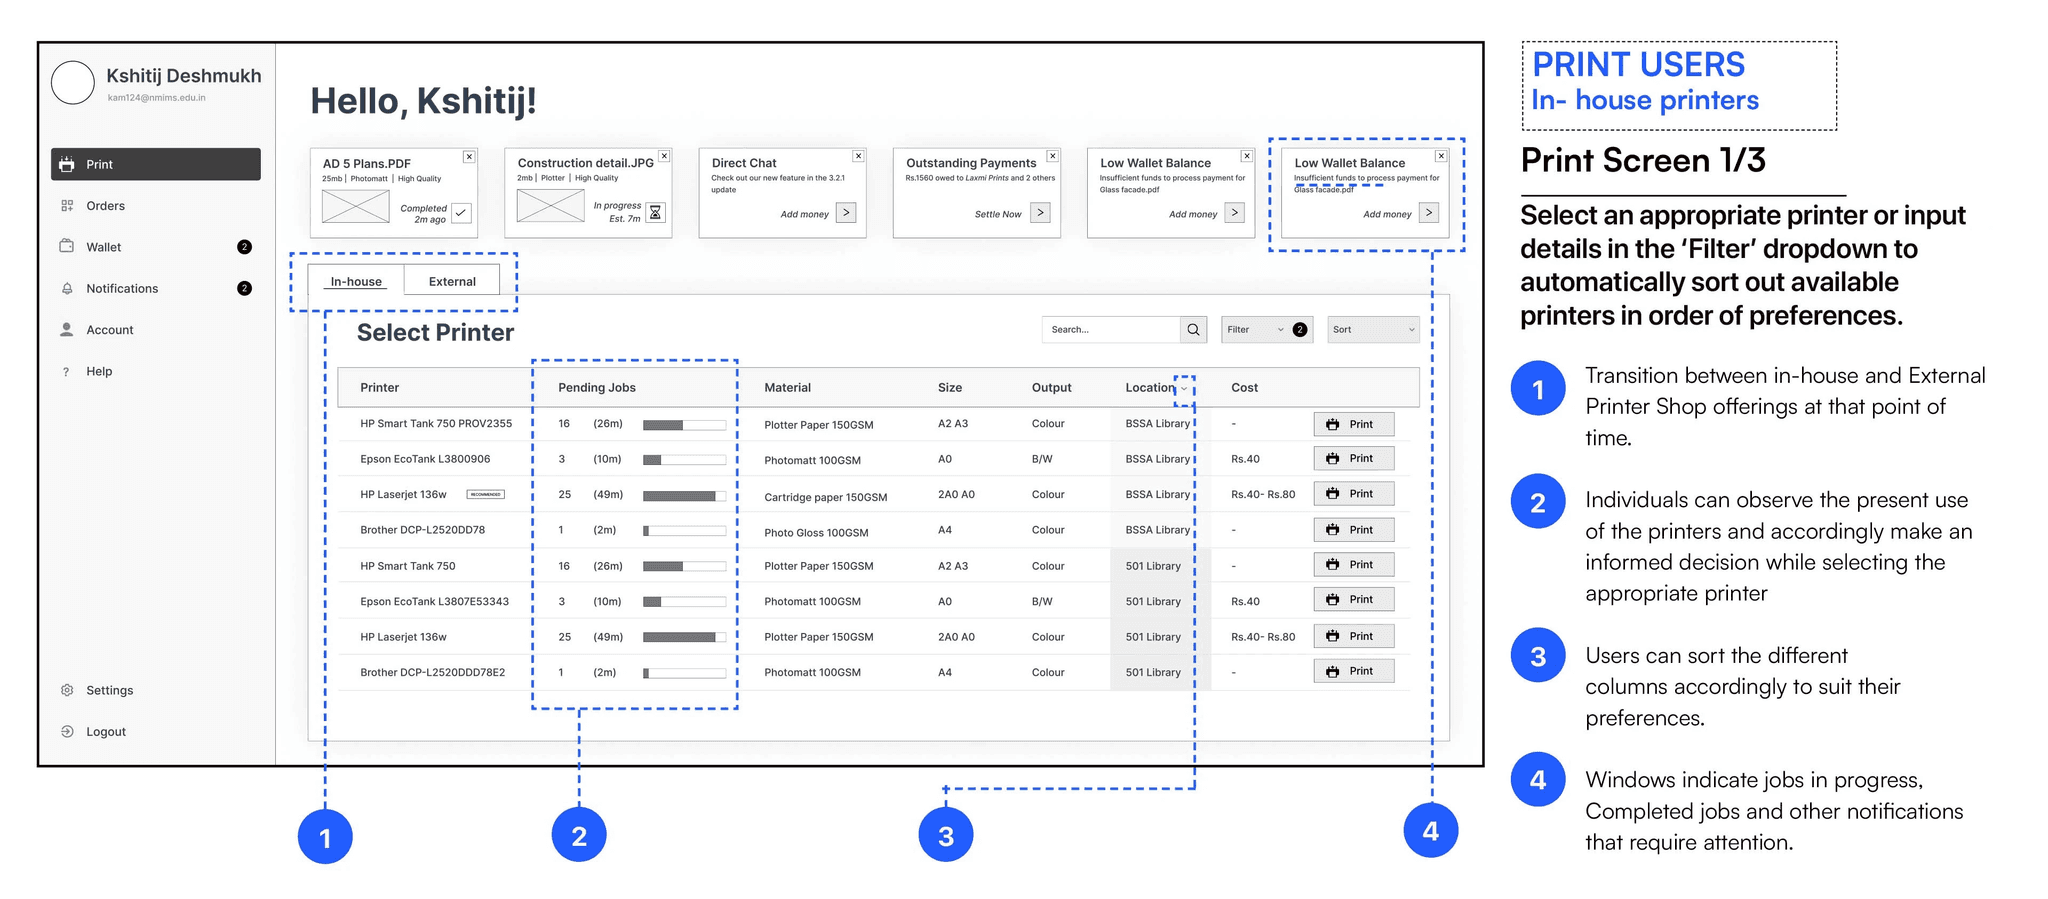
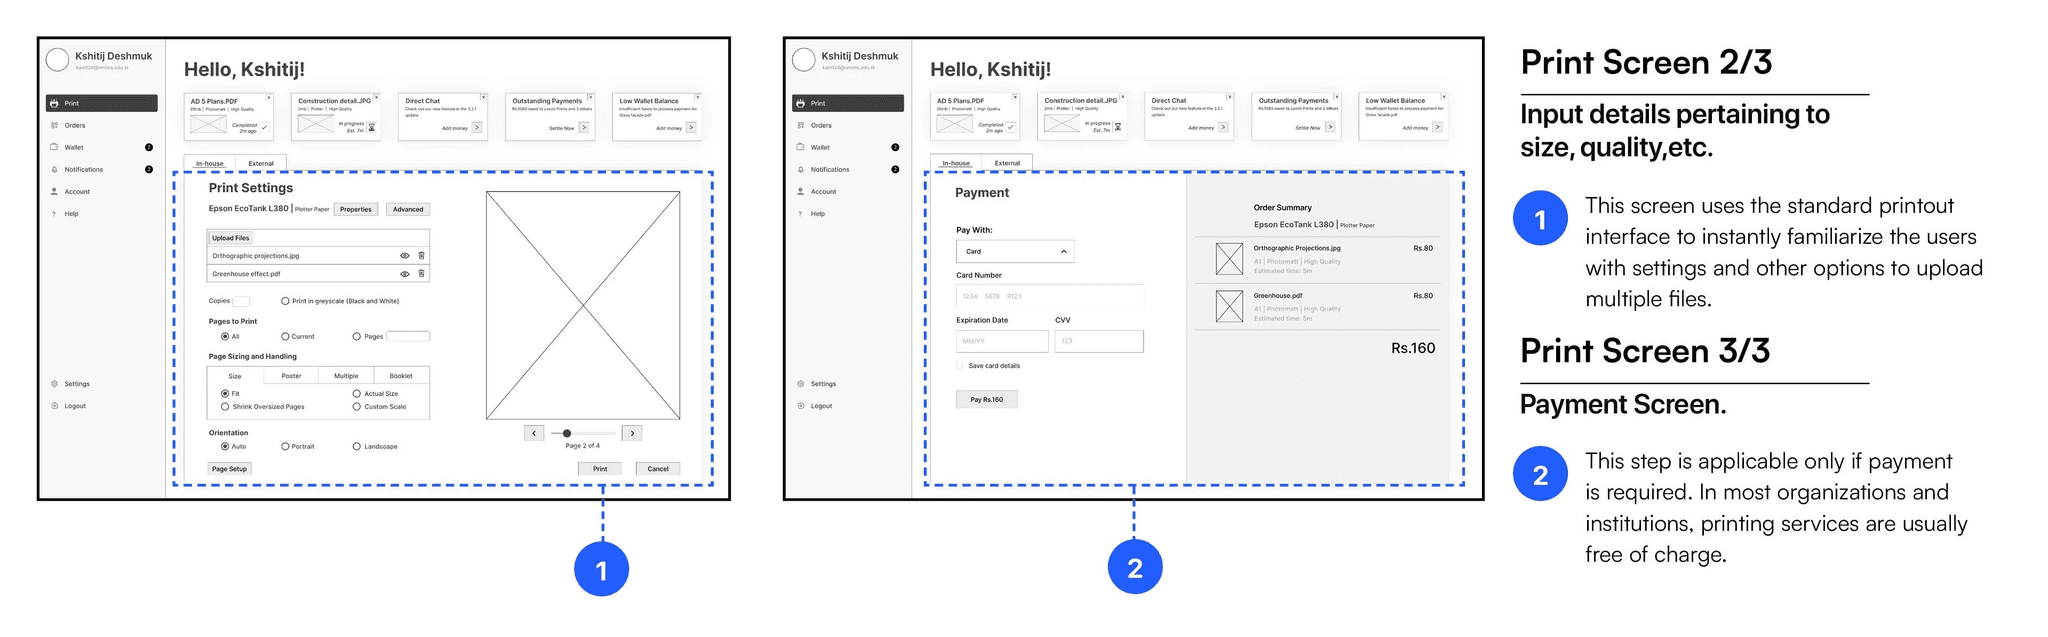
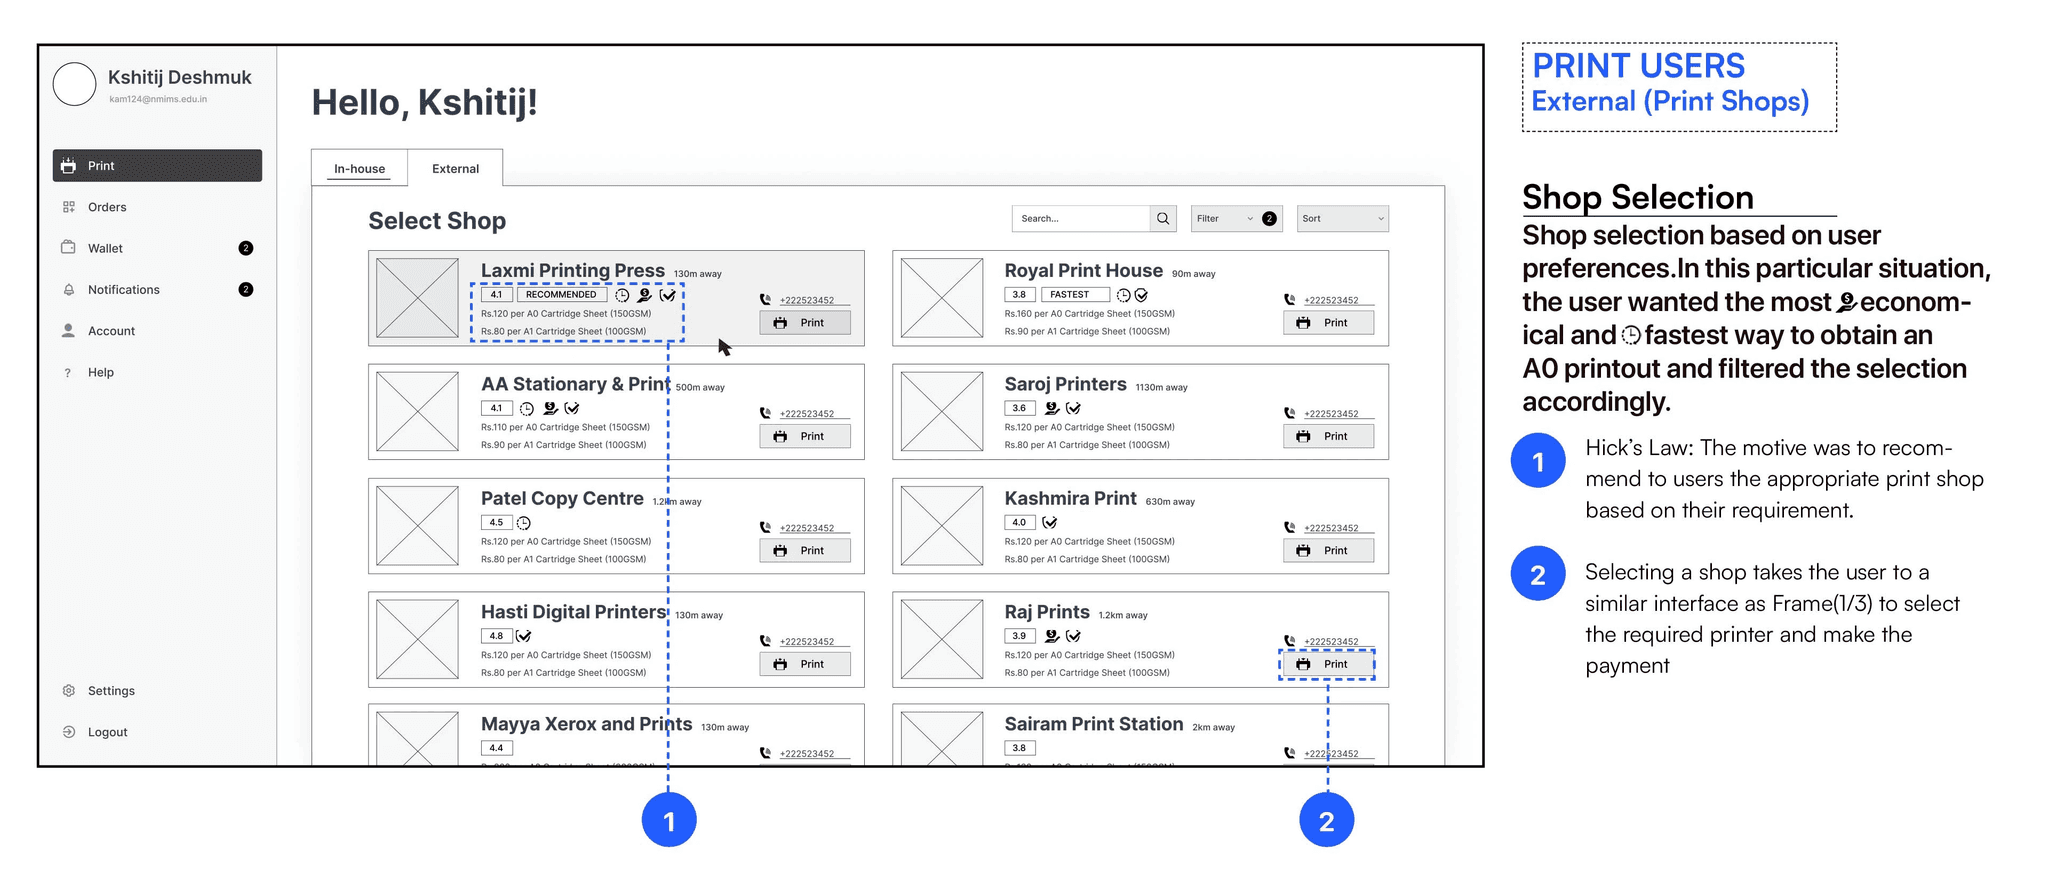
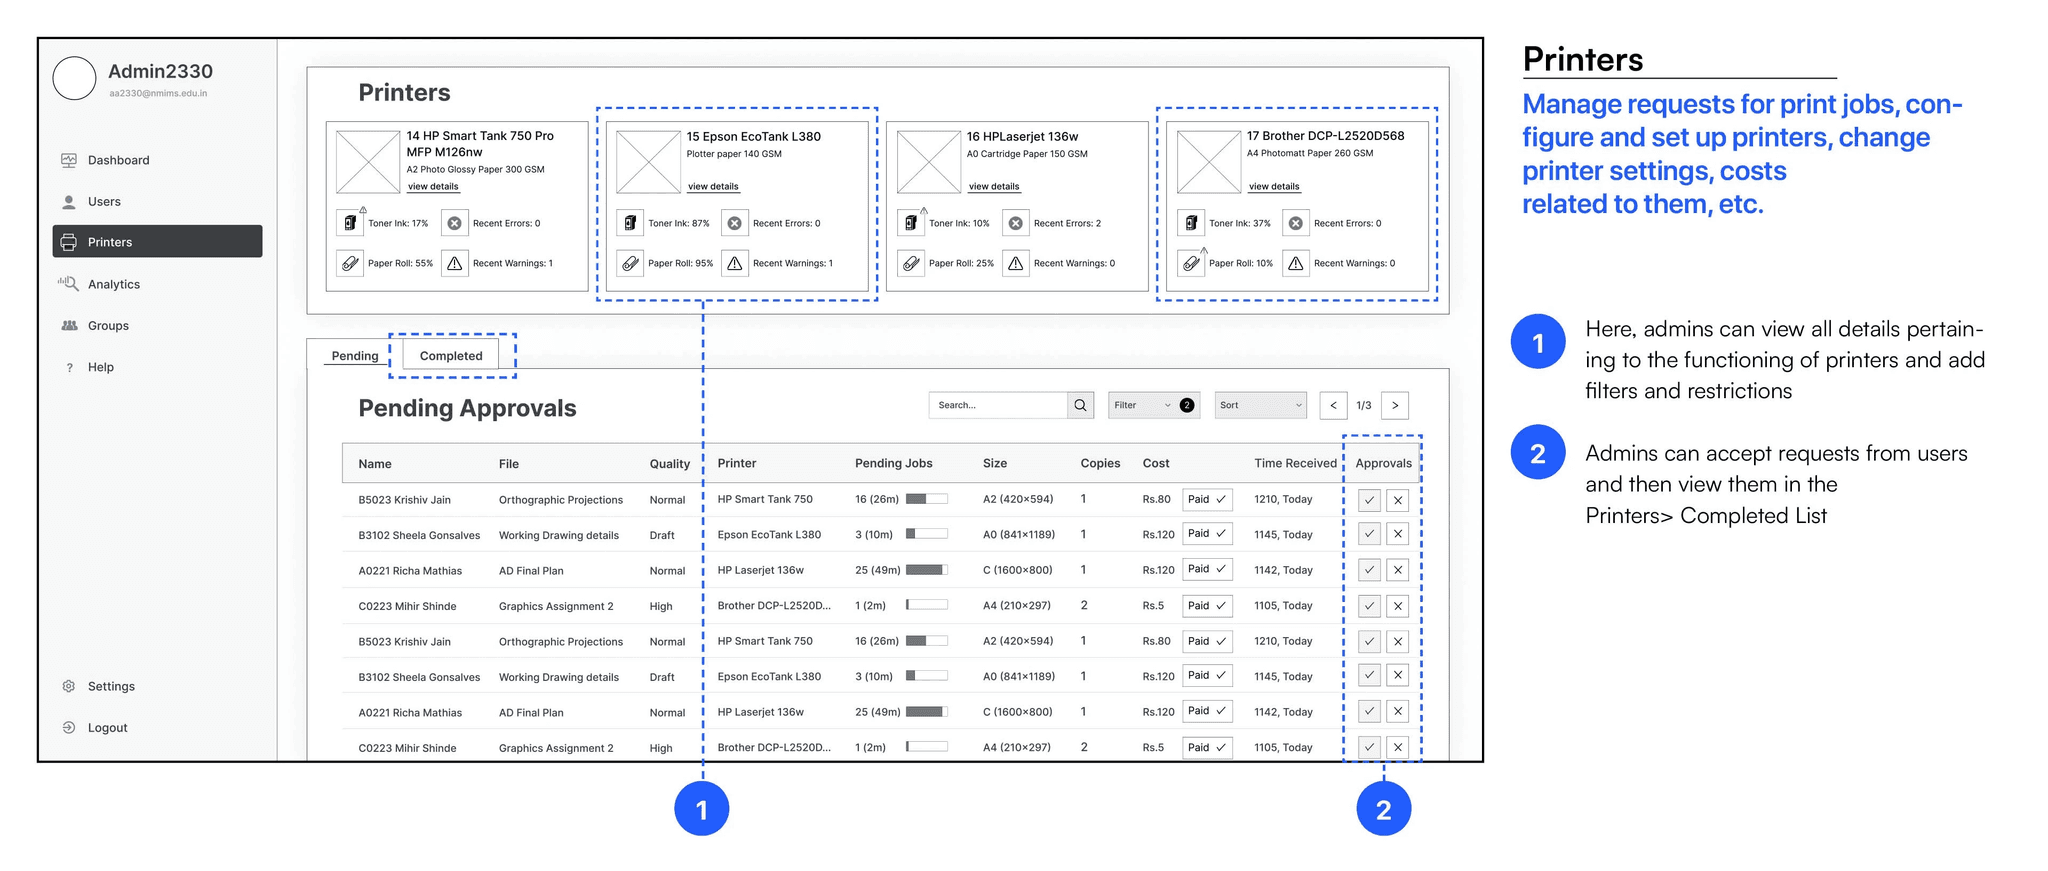
Wireframes
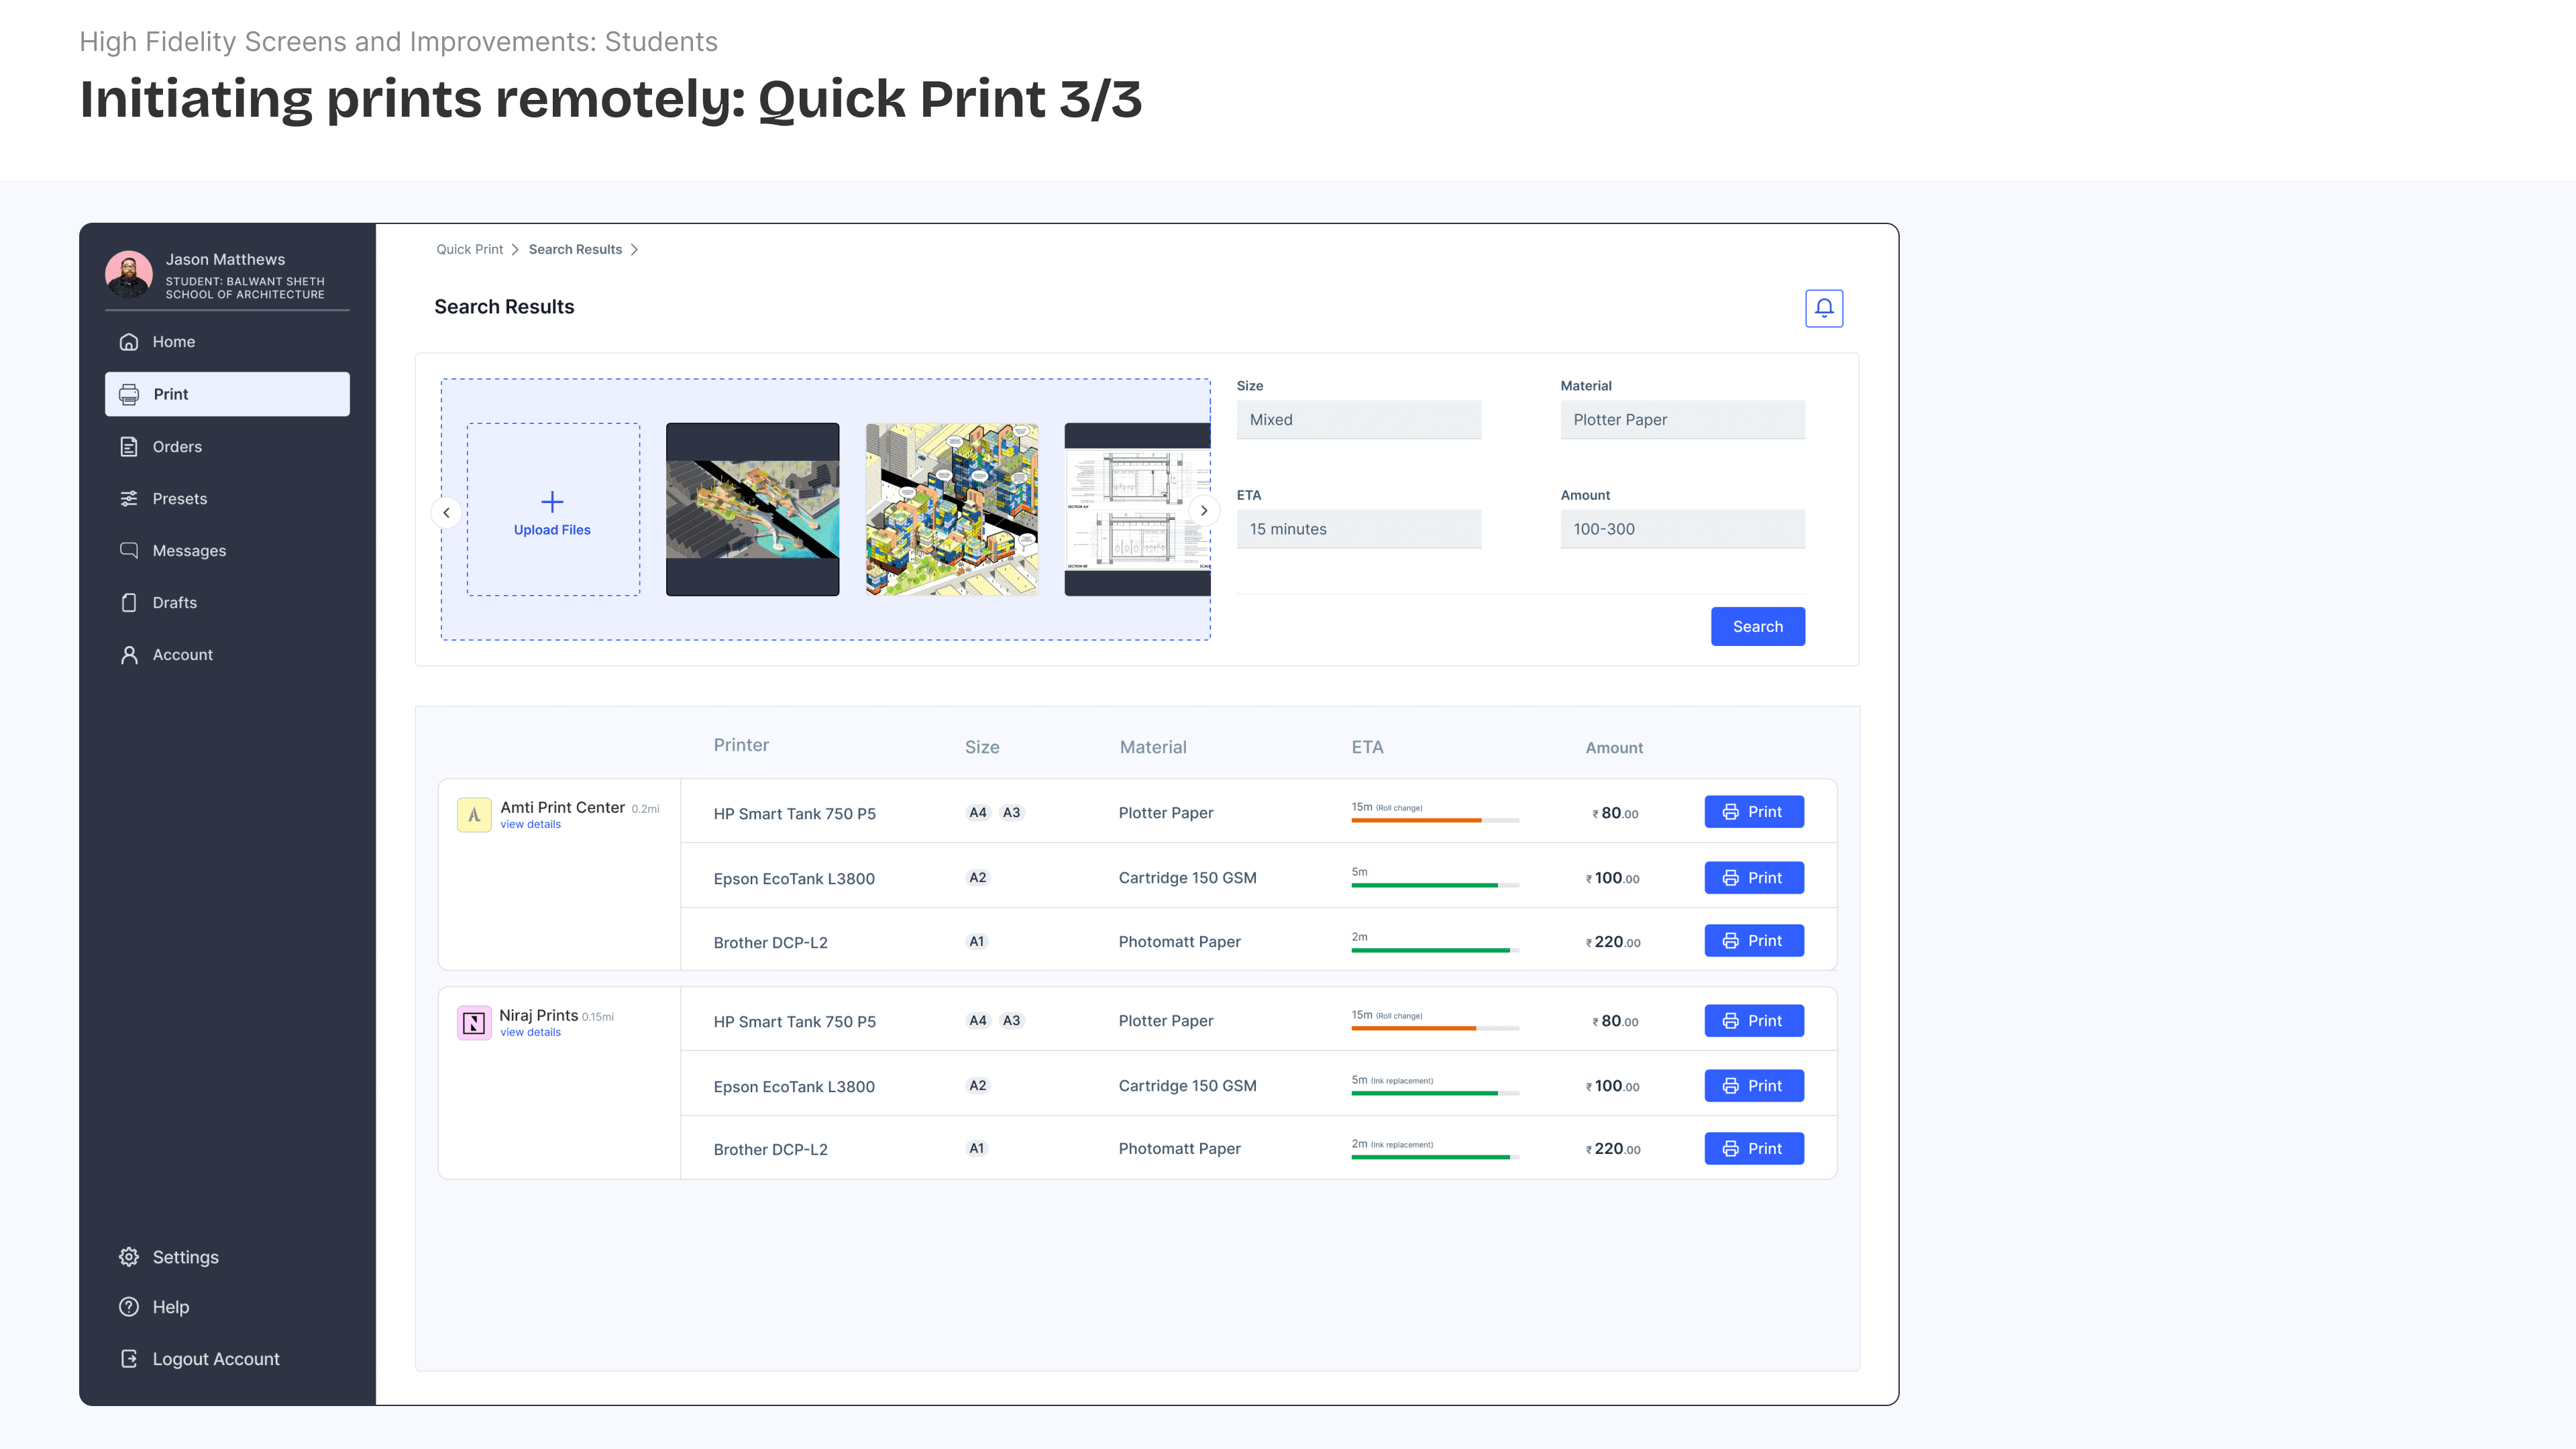
This sequence of events was well-received and the favourite aspect for the participants, was the idea of inputting print details oneself without relying on print shop employees to do so. The idea of being able to print remotely was equally appreciated.
WIREFRAMES AND IMPROVEMENTS
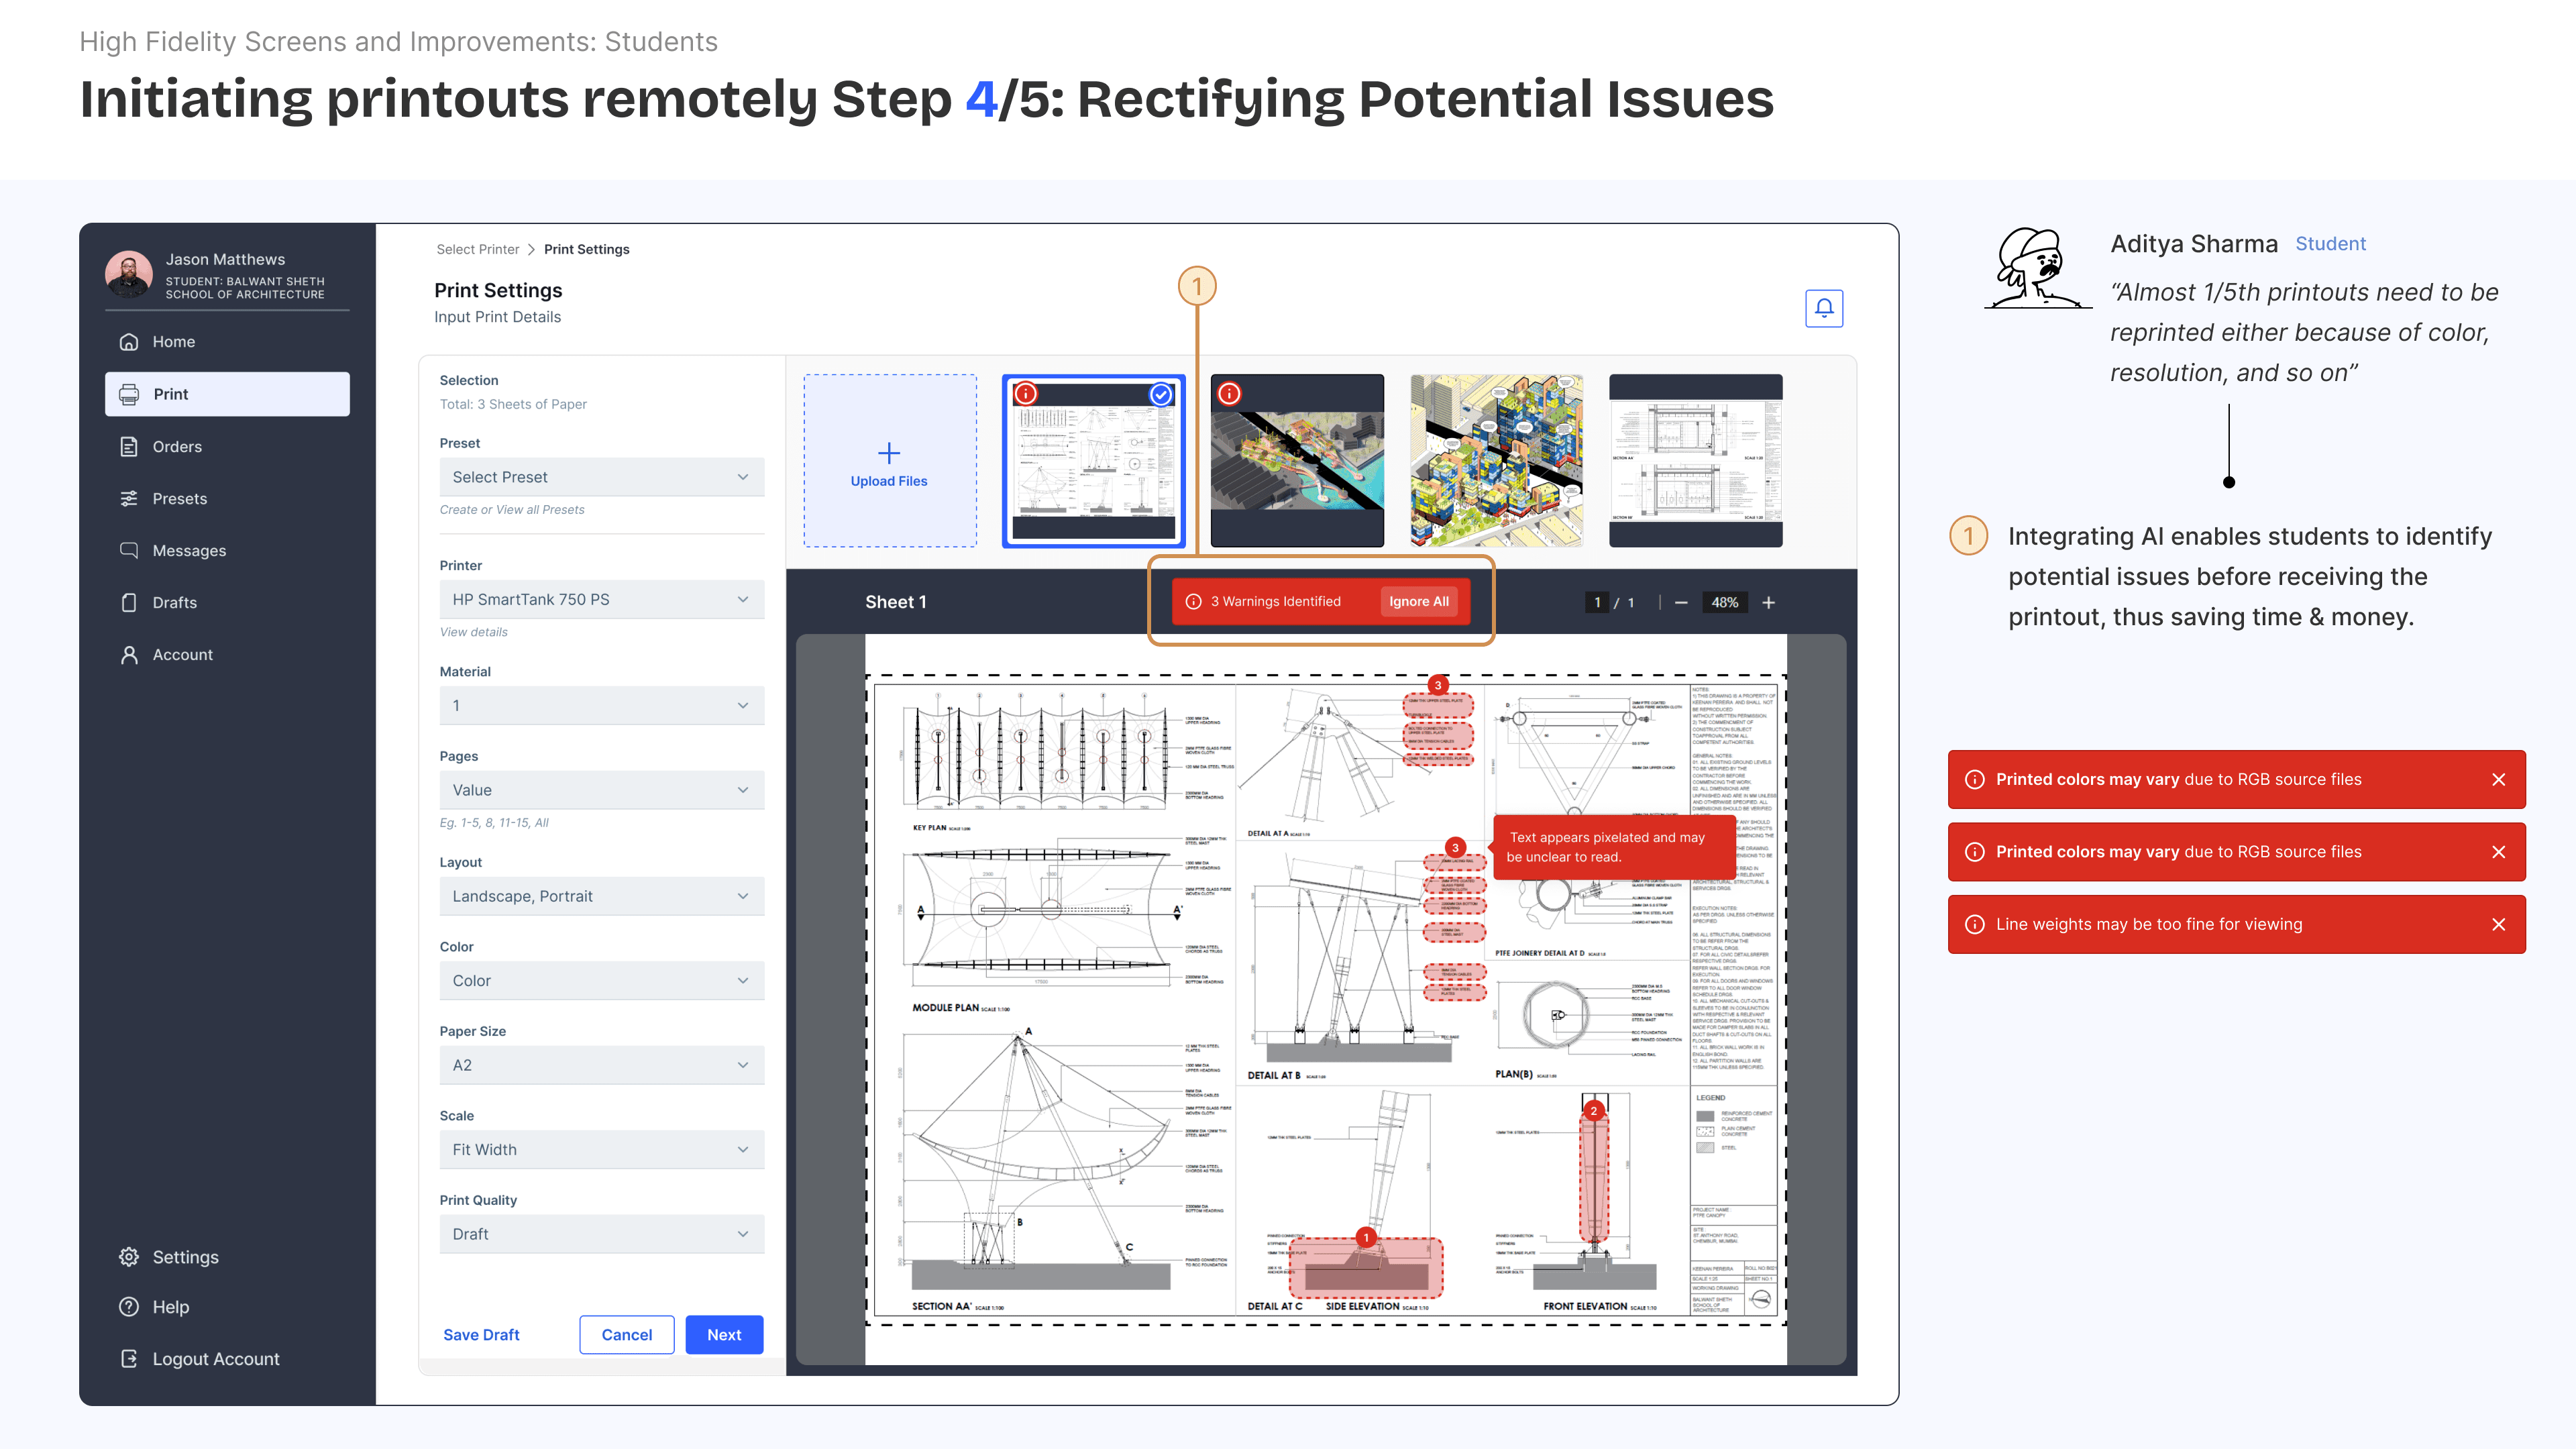
AI-enabled error prevention workflows, reduced paper waste, and improved print management.

.
Most of the features that emerged to address the needs of one of the most demanding groups ended up benefitting other individuals as well.
After testing the prototypes on different users and not just those with heavy daily print requirements, I realized that most of the features that emerged to address the needs of one of the most demanding groups ended up benefitting other individuals as well. Many of them appreciated the approximation tools and the idea of remotely initiating printouts.
However, in a context like India, multiple typologies of print shops exist, some partly run as stationary shops and others simply cater to large organizations and companies.
Understanding the different ways they operate could provide me with cues on how to further improve this app by adding additional layers of information
User Research 1
User Research 2
Design Opportunity
Ideation
Wireframing
Looking to chat?
Get in touch with me on keenan11@uw.edu