


THE PROBLEM
An increasing number of shipments per client made tracking and managing them increasingly difficult

UNDERSTANDING SHIPMENT TRACKING
Vizion API to ensure users receive consistent and standardized updates, regardless of the carrier handling their shipment
Improving visibility in the UX first required understanding the frameworks behind how shipment status information is delivered to users.
Intoglo uses Vizion API for container tracking that provides tracking data in the form of milestones.Vizion consolidates 90,000 milestones into a unified format, ensuring that end users receive consistent and standardized milestones regardless of the carriers handling their shipments.

CONCEPTS 1&2
The most straightforward solution might not always be the best

CONCEPTS 1&2: ANALYSIS
The overemphasis on route, need for a layout that accommodates more shipments and enables easier scanning of specific attributes when filtering led us to explore alternatives

Concept 1

Concept 2
CONCEPT 3
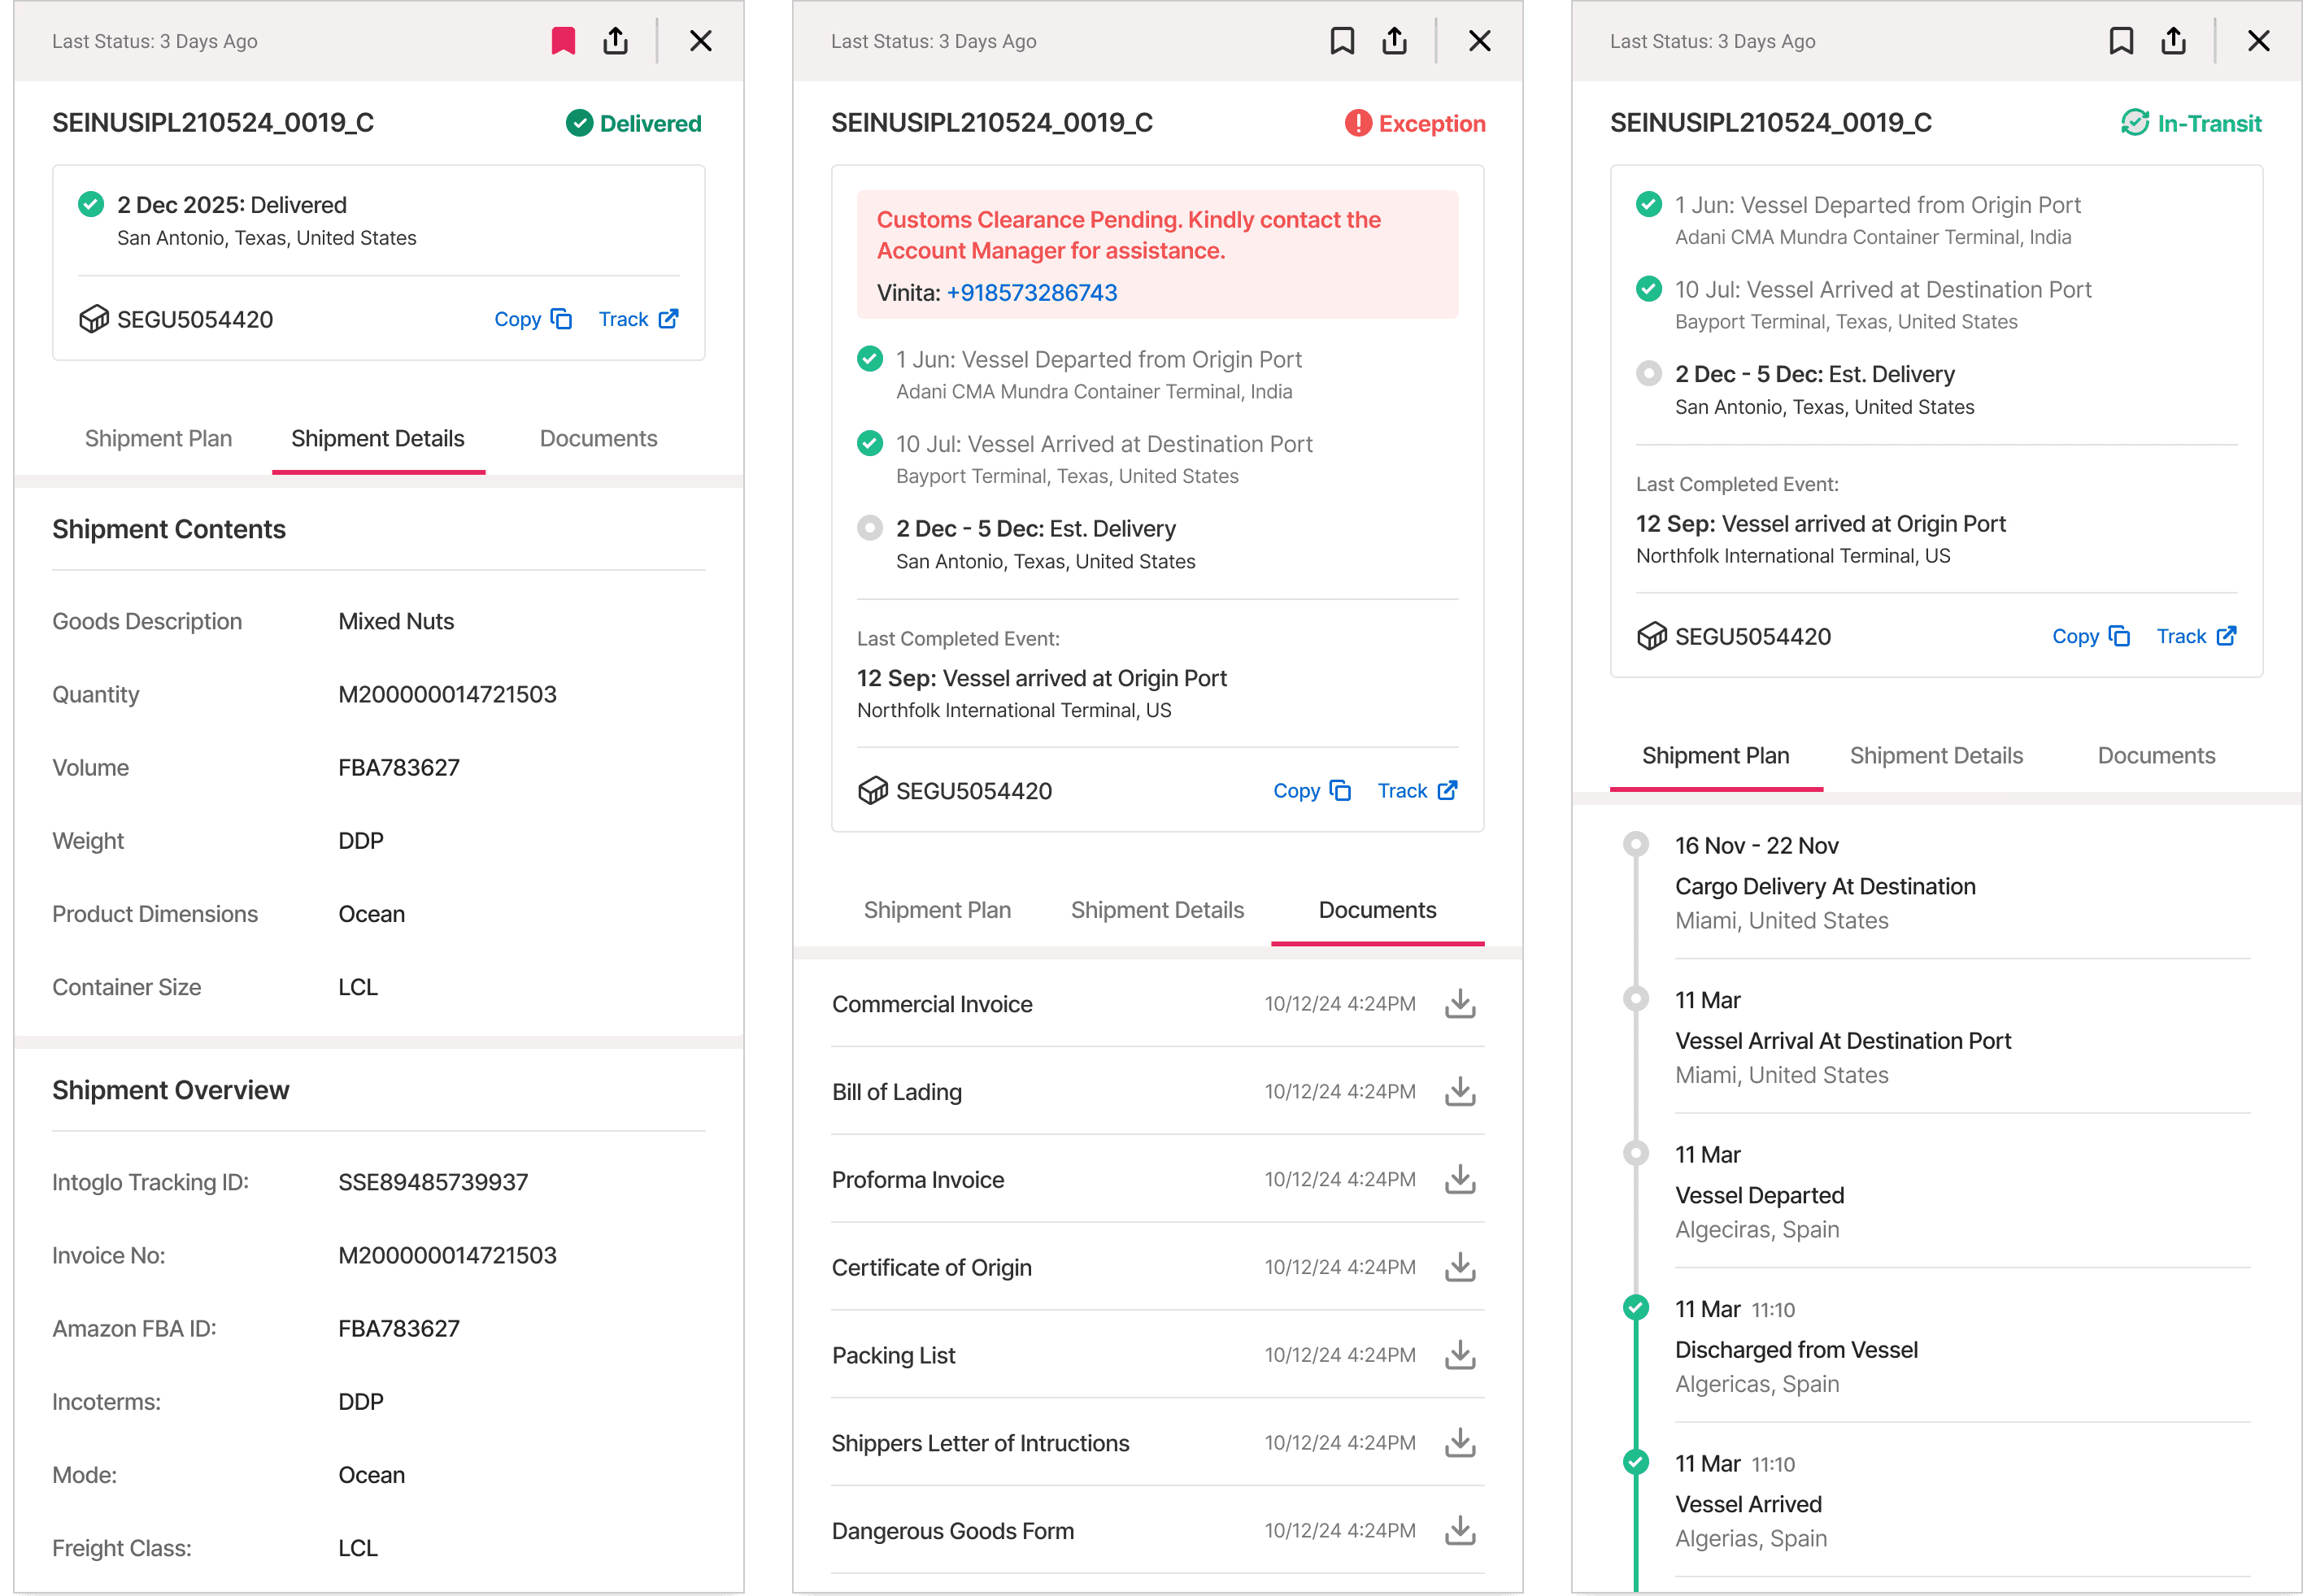
In order to address the previously identified issues, I proposed an alternative. This time, based on the existing knowledge of users and their familiarity with Excel, which resulted in a data table that mirrors this experience.
As a starting point, this concept was highly valued by the PM and the CTO for its simplicity, capacity to display more shipments and the convenience it offered in filtering and sorting based on individual needs.

Concept 3

A more clear depiction of the time left until final delivery
To address this, we decided to use the final estimated delivery date as the endpoint for the progress bar, with the current date representing the point on the bar. While this wasn’t a flawless solution, since shipment durations varied, these variations weren’t significant, as all shipments were from India to the USA, with the difference between the longest and shortest delivery times being just a couple of days. Therefore, this method provided a more accurate representation of the remaining time until arrival compared to our previous approach.

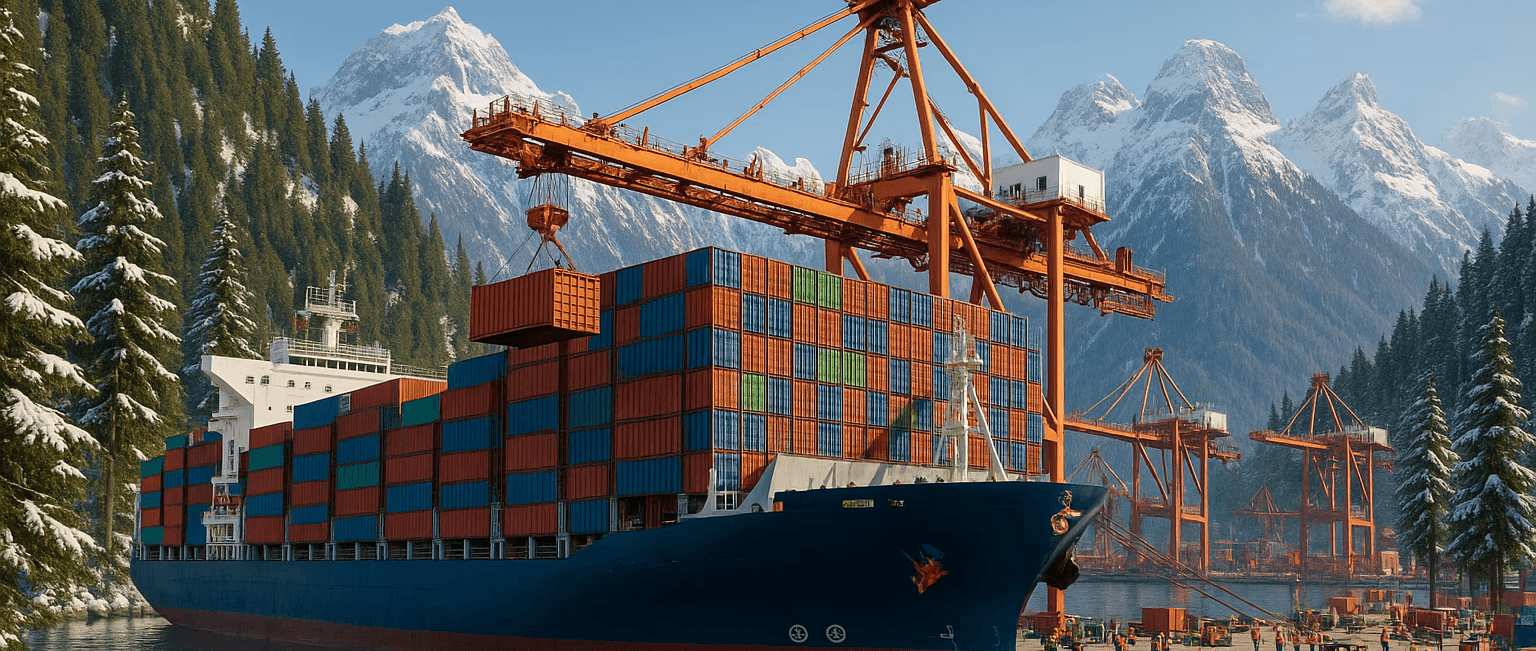
Shipment Details


A Desktop Pane designed to fit the mobile screen will save us a lot of time and effort, while ensuring a consistent UX across different platforms
Why not use my version: a side pane, but design it in a way that it could also function as a full-screen pane on mobile? This approach would not only maintain a consistent user experience for shipment details across devices but also streamline development by reusing the same design for both desktop and mobile interfaces.

And thats a wrap... or maybe not
Ultimately, this approach allowed us to hand over the work to engineering ahead of schedule. We then finalized the interactions, variants, and were prepared for the dev handoff. Below are the screens I produced.

A NEW PROBLEM SURFACED
Until now, when a user booked a shipment, Intoglo would estimate the final delivery date to the last-mile location using a specific logic. However, the confirmation of pick-up by trucking companies and final delivery was typically decided much later, once the vessel's arrival at the destination port was imminent or confirmed.

THE SOLUTION
This also validated our hypothesis that the problem was primarily an expectation management issue. Users weren’t making major business decisions based on the initial final delivery date; they were mainly frustrated that we provided a date that the shipment consistently failed to meet.
Looking to chat?
Get in touch with me on keenan11@uw.edu